Application View
The Applications Module allow users to manage and monitor XAP applications. It offers a wide set of functionality from deployment to verification, monitoring and even log tracing.
The picture below explains the different parts composing the Applications module
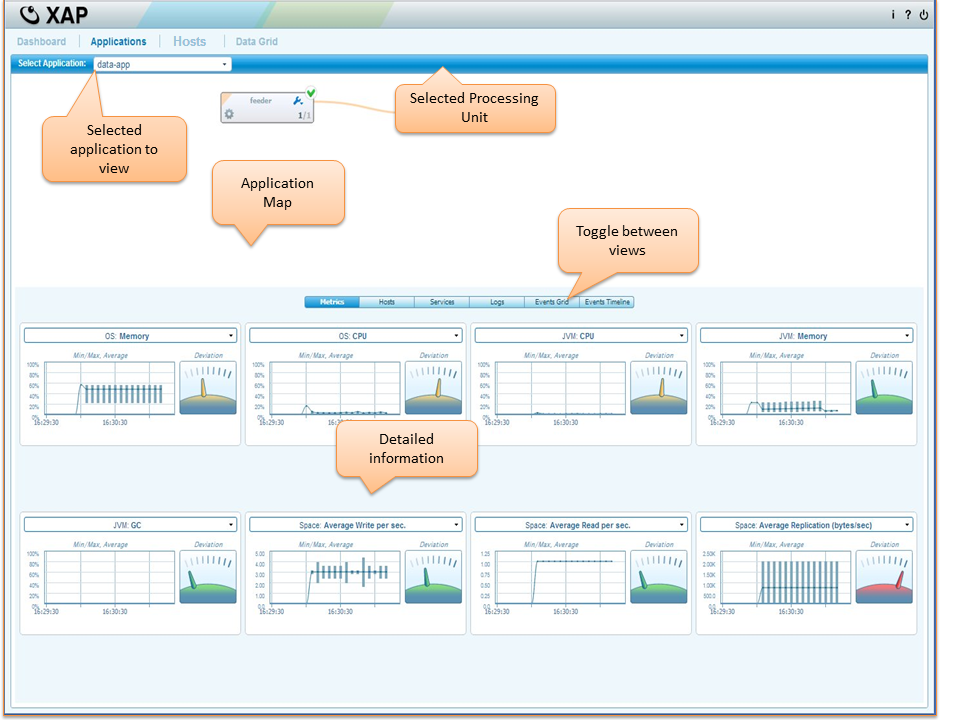
Application Map
The application map is a graphical representation of the deployment plan (processing units, their SLA and their dependencies) It allow the user to compare the plan with the actual deployment in any given moment. the next sections give detailed explanation of the application map functionality
Overview
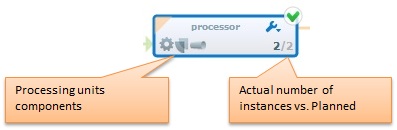
Understanding the processing unit display
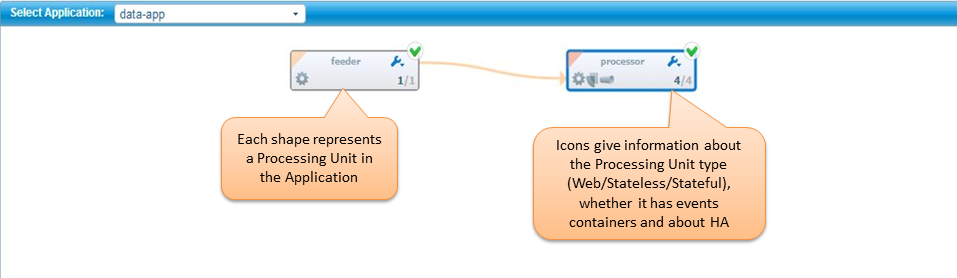
The application map depicts a shape per each processing unit
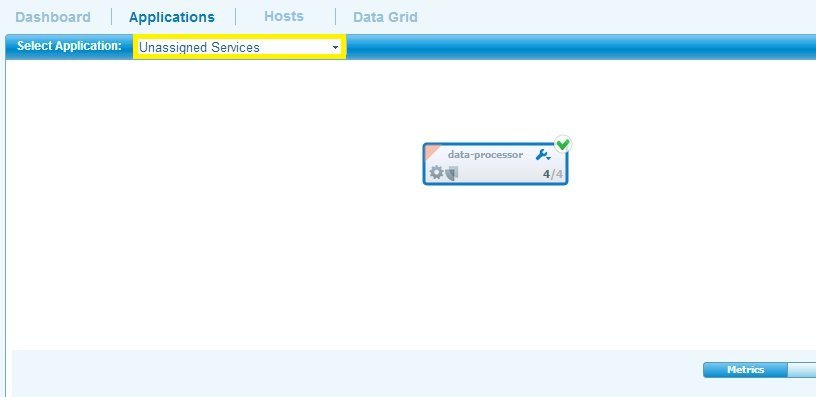
It shows the deployment and dependencies between each processing unit, belonging to the chosen “application” from the drop-down menu. Processing units that were not deployed in the context of an application, will be shown under “Unassigned Services”.
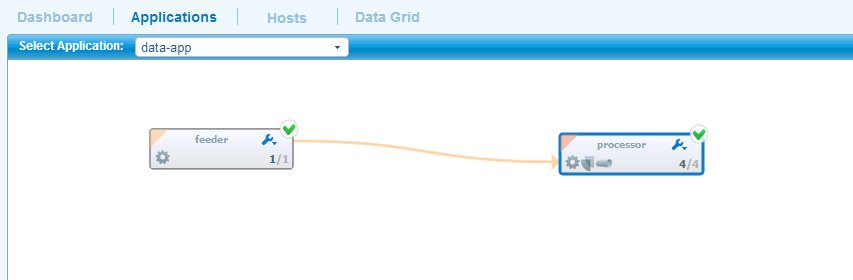
Processing Unit dependencies
Dependencies between processing units are depicted by an arrow flowing in the direction of “depends on”. For example, in the screenshot below, the feeder depends on the Space to be alive.
For more information on processing unit dependencies, see Application deployment and processing unit dependencies
The following table explains these icons
 |
Space Partition |
 |
Space Partition with backup |
 |
Space Replica |
 |
Processing (Business Logic) |
 |
Event Container (Messaging) |
 |
Web application |
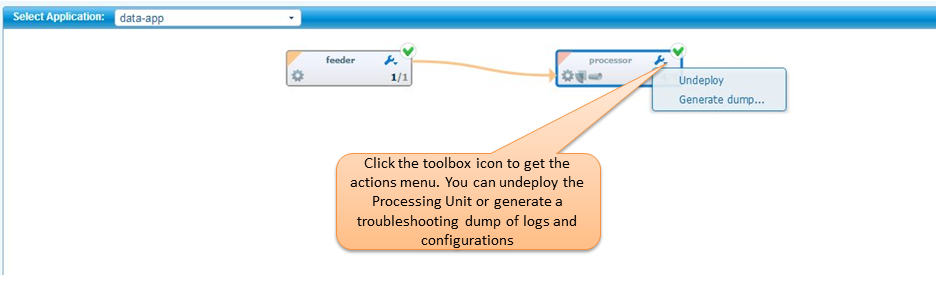
Contextual Actions
The Monitoring view
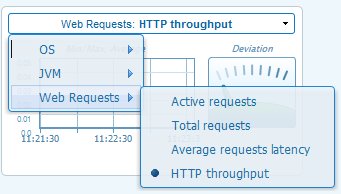
The monitoring view, allow the user to monitor the performance of a the selected processing unit. The displayed statistics are at the cluster level.
Understanding the widgets
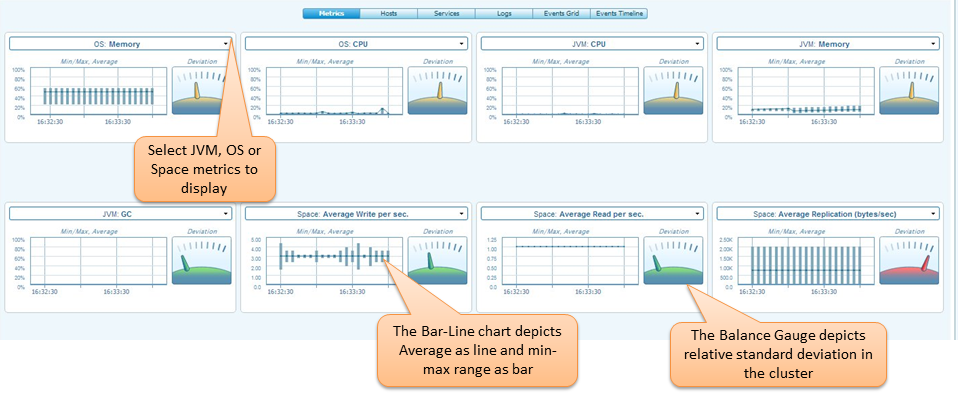
Stateful Processing Unit metrics:
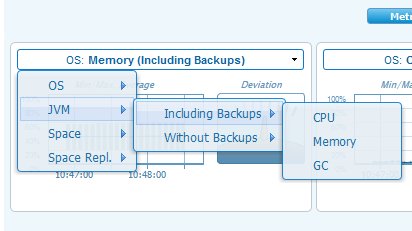
In the case of backup spaces OS and VM metrics can be selected either for all instances of Processing Unit( Cluster ) or all instances without backups. The same with Processing Unit that has replication.
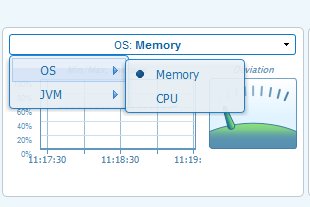
OS metrics
- Memory
- CPU
JVM metrics
- Memory
- CPU
- GC
Space replication
- Replication TP(bytes/sec)
- Redo Log Size
- Redo Log Memory Packets Count
- Redo Log External Storage Packet Count
- Redo Log External Storage Space Used
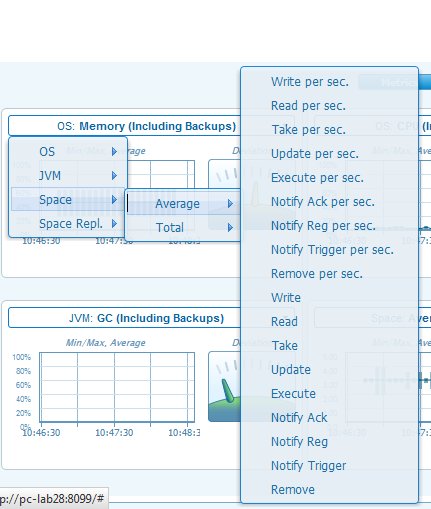
Total and average Space operation metrics are available for selection as well.
Space Troughput
- Write per sec.
- Read per sec.
- Take per sec.
- Update per sec.
- Execute per sec.
- Notify Ack per sec.
- Notify Reg per sec.
- Notify Trigger per sec.
- Change per sec.
Space operations
- Write
- Read
- Take
- Update
- Execute
- Notify Ack
- Notify Reg
- Notify Trigger
- Change
Stateless Processing Unit metrics:
Web Processing Unit metrics:
Mirror metrics:
OS metrics
- Memory
- CPU
JVM metrics
- Memory
- CPU
- GC
Mirror
- Failed operations count
- Mirror Write per sec.
- Mirror Update per sec.
- Mirror Remove per sec.
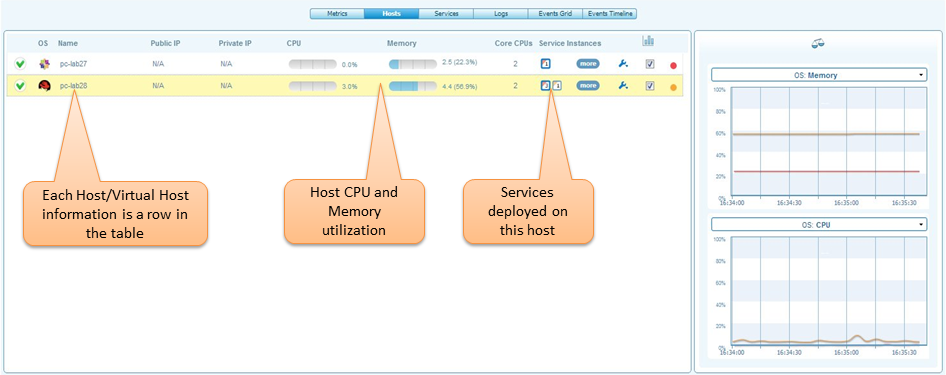
The Infrastructure view
The infrastructure view allow the user to verify the application’s topology. It maps the processing unit instances to hosts, providing some basic information about each host.
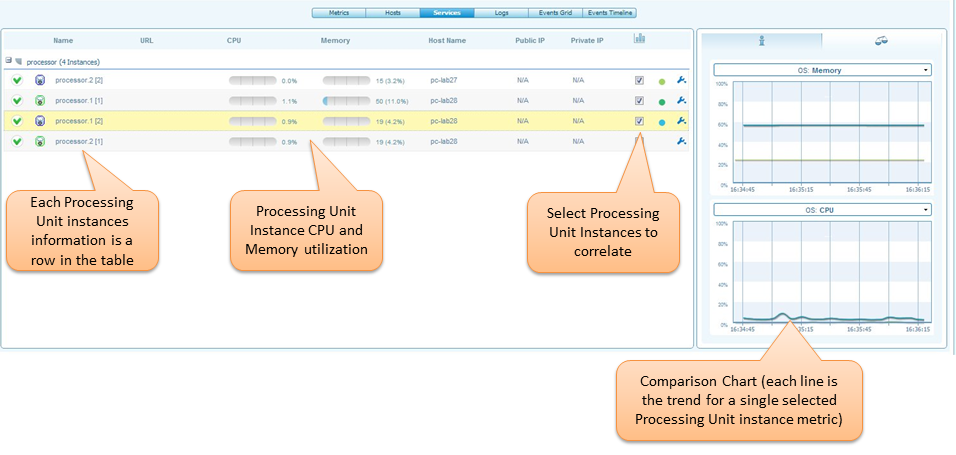
The Services view
The services view allow the user to get information at the processing unit instance level and to correlate performance of several selected instances.
Comparing Instances
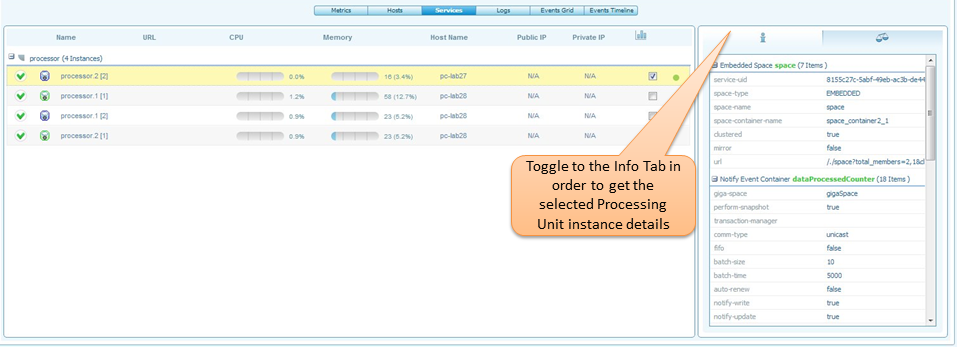
Service Instance Details
Contextual Actions
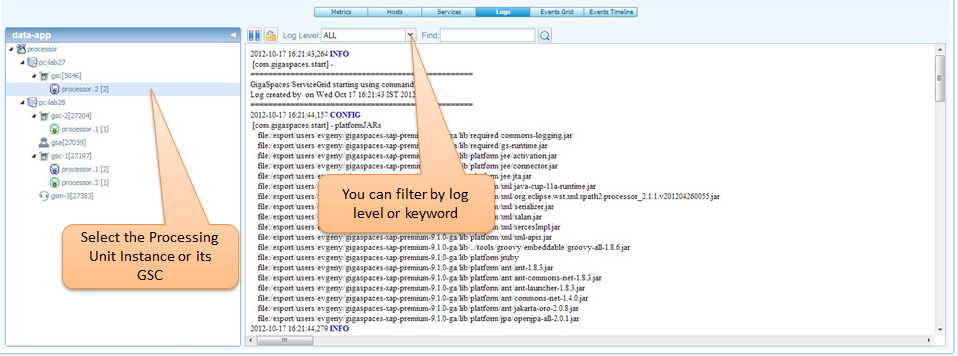
The Logs view
The logs view allow the user to browse the application logs, filter or search them.
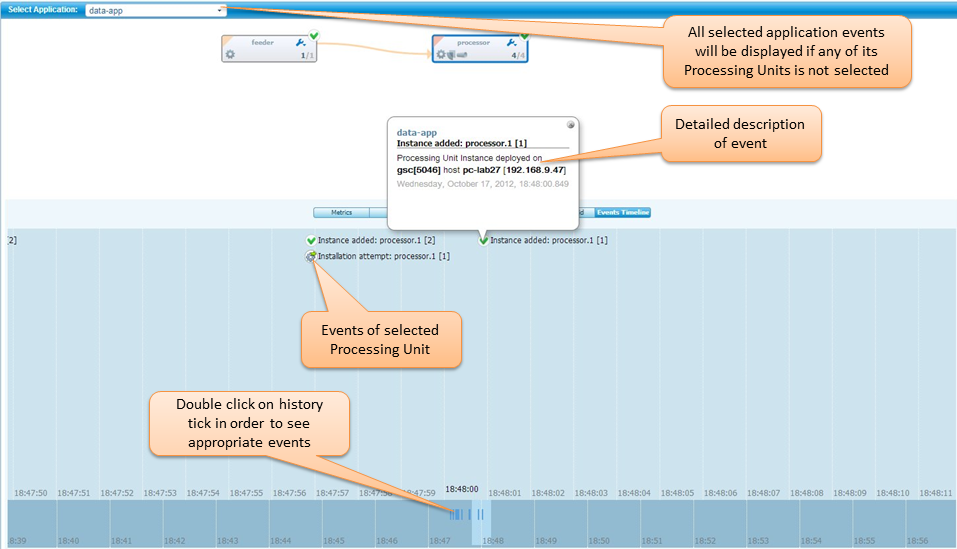
Events time-line (per application)
The events time line is filtered per application chosen from the application drop-down menu. The events time-line shows the deployment life cycle of all the processing units belonging to this application.
For more information on the events displayed, see Events time-line tab in dashboard view
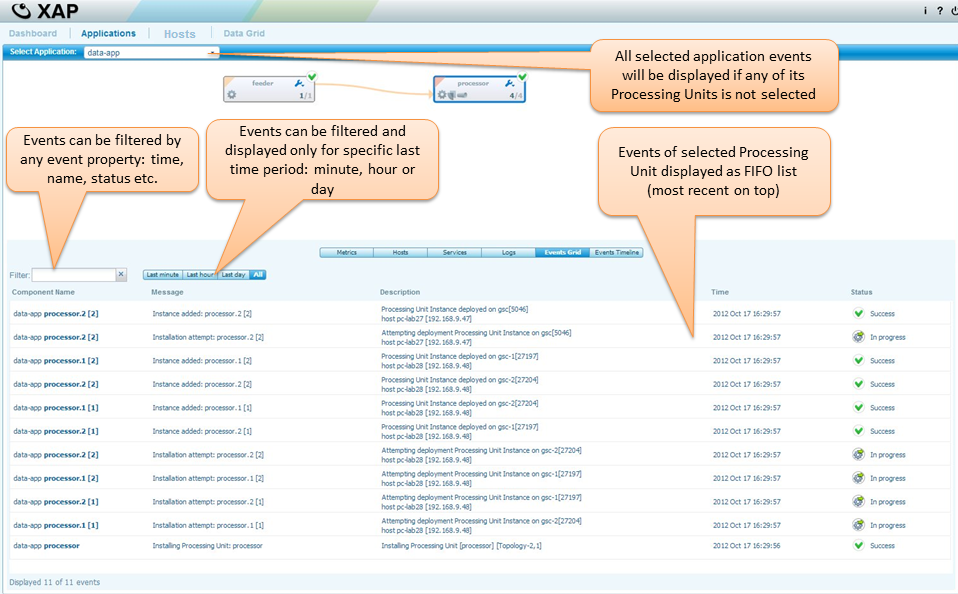
Events table (per application)
The events table is filtered per application chosen from the application drop-down menu. The events table shows the deployment life cycle of all the processing units belonging to this application.
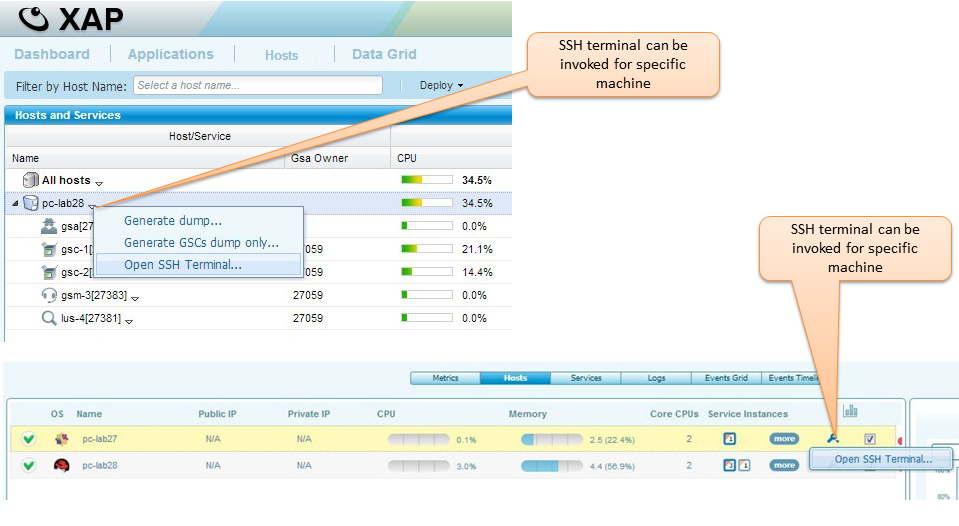
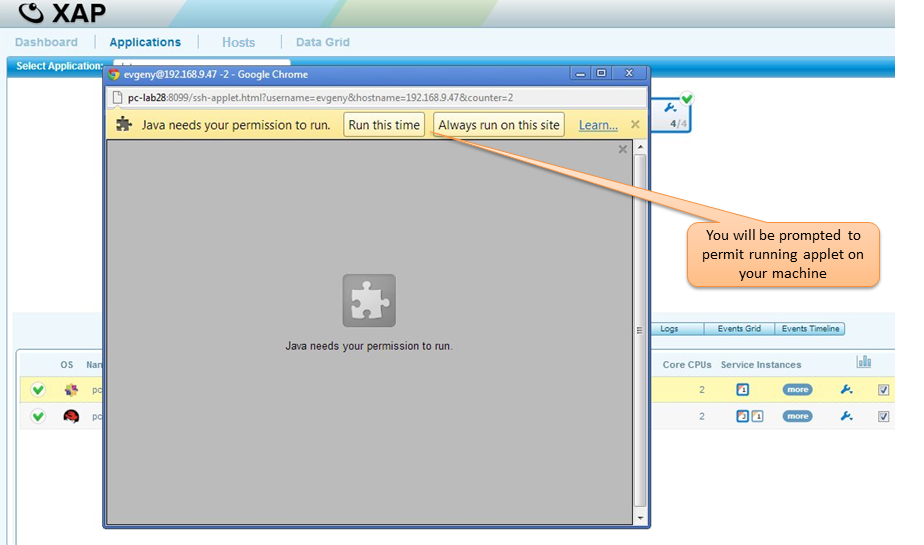
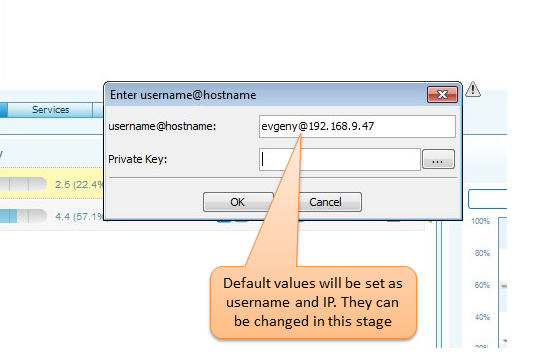
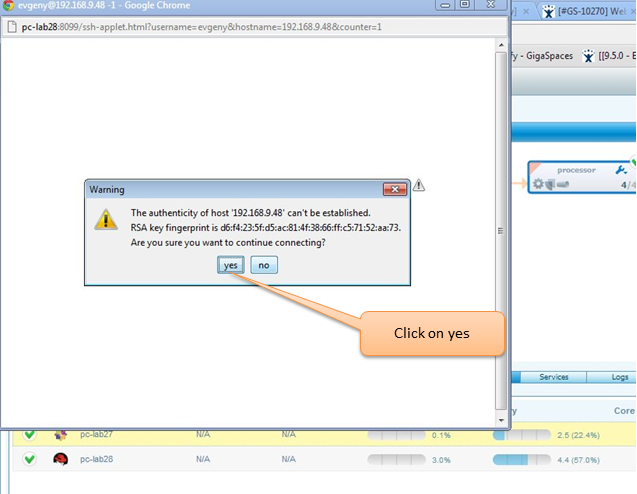
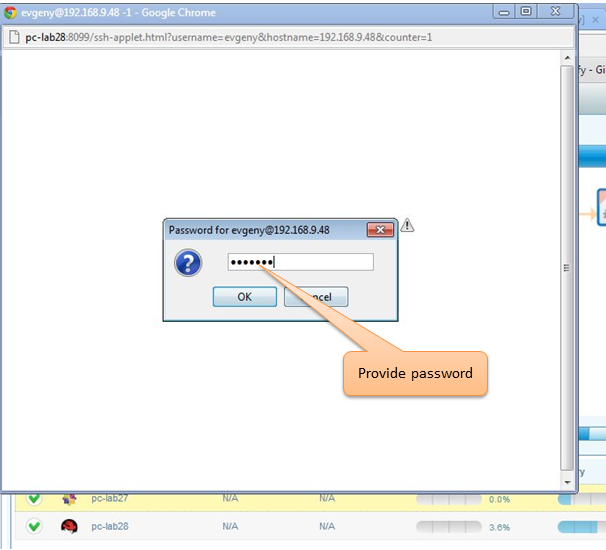
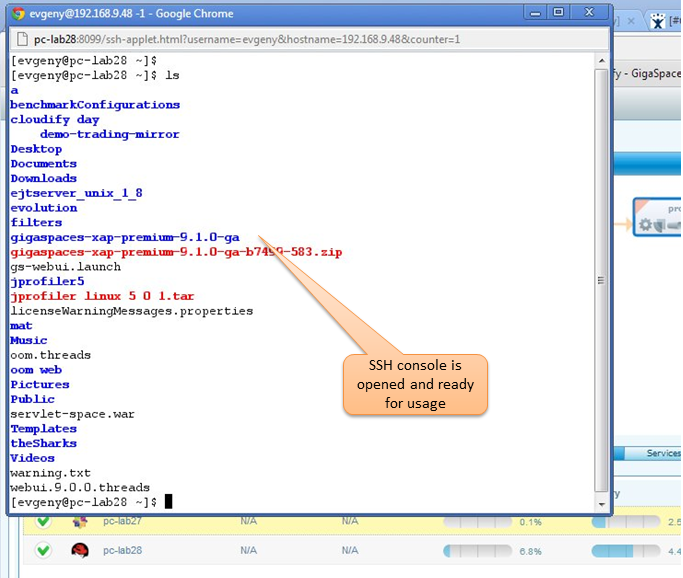
SSH terminal
There is an option to open SSH terminal for specific machine