Viewing the Deployed Processing Units
To view information about the deployed Processing Units:
Processing Unit
Command
xap pu list
Description
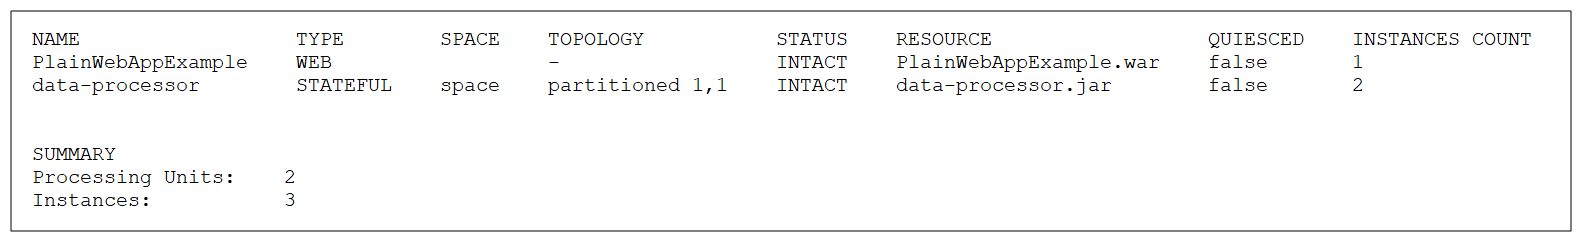
This command lists all the Processing Units in a table with the Processing Unit name, type, Space, topology, status, file name, state, and number of instances.
Input Example
<XAP-HOME>/bin/xap pu list
Output Example
Parameters and Options
None.
Processing Unit instance
Command
xap pu list-instances <name>
Description
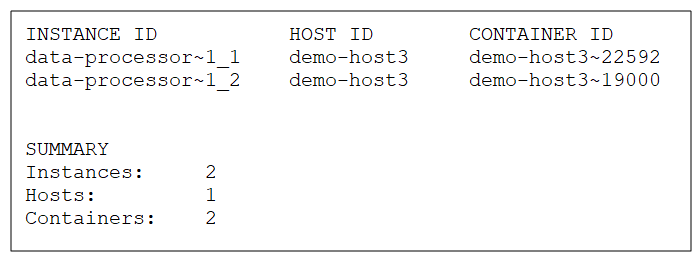
This command lists all of the instances for a given Processing Unit, along with the Instance ID, Host ID, and Container ID.
Input Example
<XAP-HOME>/bin/xap pu list-instances data-feeder
Output Example
Parameters and Options
| Item | Name | Description |
|---|---|---|
| Parameter | name | Name of Processing Unit to list instances for. |
All Processing Units
Path
GET /pus
Description
The Processing Units are listed with the name, Processing Unit type, file name, topology, number of instances, SLA information, and additional details.
Example Request
curl -X GET --header 'Accept: application/json' 'http://localhost:8090/v2/pus'
Example Response
[
  {
    "name": "monitorSpace",
    "processingUnitType": "stateful",
    "resource": "datagrid",
    "topology": {
      "instances": 1
    },
    "sla": {
      "requiresIsolation": false,
      "zones": [],
      "maxInstancesPerVM": 0,
      "maxInstancesPerMachine": 0
    },
    "spaces": [
      "monitorSpace"
    ],
    "scalable": false,
    "status": "intact",
    "quiesceDetails": {
      "quiesced": false,
      "description": "initial"
    },
    "instances": [
      "monitorSpace~1"
    ]
  },
  {
    "name": "alertSpace",
    "processingUnitType": "stateful",
    "resource": "datagrid",
    "topology": {
      "instances": 1
    },
    "sla": {
      "requiresIsolation": false,
      "zones": [],
      "maxInstancesPerVM": 0,
      "maxInstancesPerMachine": 0
    },
    "spaces": [
      "alertSpace"
    ],
    "scalable": false,
    "status": "intact",
    "quiesceDetails": {
      "quiesced": false,
      "description": "initial"
    },
    "instances": [
      "alertSpace~1"
    ]
  }
]
Options
None
Specific Processing Unit
Path
GET /pus/{id}
Description
The given Processing Unit is listed with the name, Processing Unit type, file name, topology, number of instances, SLA information, and additional details.
Example Request
curl -X GET --header 'Accept: application/json' 'http://localhost:8090/v2/pus/alertSpace'
Example Response
{
  "name": "alertSpace",
  "processingUnitType": "stateful",
  "resource": "datagrid",
  "topology": {
    "instances": 1
  },
  "sla": {
    "requiresIsolation": false,
    "zones": [],
    "maxInstancesPerVM": 0,
    "maxInstancesPerMachine": 0
  },
  "spaces": [
    "alertSpace"
  ],
  "scalable": false,
  "status": "intact",
  "quiesceDetails": {
    "quiesced": false,
    "description": "initial"
  },
  "instances": [
    "alertSpace~1"
  ]
}
Options
| Option | Description | Required |
|---|---|---|
| pu name | Provide the name of the Processing Unit for which you want to see the runtime details. | Yes |
Processing Unit Instance
Path
GET /pus/{id}/instances/{instanceId
Description
The given Processing Unit Instance is listed with the Instance ID, Processing Unit name, Host ID, Container ID, and Partition ID, and Backup ID.
Example Request
curl -X GET --header 'Accept: application/json' 'http://localhost:8090/v2/pus/alertPu/instances/alertPu~1'
Example Response
{
  "id": "alertPu~1",
  "processingUnitName": "alertPu",
  "hostId": "admin",
  "containerId": "admin~13972",
  "partitionId": 0,
  "backupId": 0
}
Options
| Option | Description | Required |
|---|---|---|
| pu name | Provide the name of the Processing Unit for which you want to see the runtime details. | Yes |
| instanceId | Provide the instanceId of the Processing Unit for which you want to see the runtime details. | Yes |
You can see the following Processing Unit details in the main Processing Units view:
| Item | Description |
|---|---|
| Name | Name of the Processing Unit. Expand the Processing Unit node to view the name of the Processing Unit instance, and below that the Space name. |
| Status | Current status of the Processing Unit:
|
| Type | Indicates whether the Processing Unit is stateful or stateless. |
| Host Name | Name of the machine hosting the Processing Unit instance. |
| PID | Process ID of the Processing Unit instance. |
| Application | Client application that is running, if applicable. |
| Zones | If configured, the zone where the Processing Unit is located. |
| CPU | Amount of CPU resources being used by the Processing Unit instance, in percent. |
| Used Heap | Amount of JVM heap being used by the Processing Unit instance, in MB (% of allocated heap). |
If the Space is highlighted, you can click the Actions icon and drill through to the Spaces view to see the Space details.
Refer to the GigaSpaces Management Center topics in the Administration section.
Refer to the Admin API topics in the Developers Guide.