Monitoring
Overview
Monitoring a production environment of any system requires inspecting many statistics, and XAP is no different. The Web Management Console provides various metrics by polling the system’s components, but these statistics have a few limitations:
- History - Since statistics are polled and aggregated at runtime in memory, they’re limited to a few minutes of history, whereas in production users often need to store metrics for a few days at least.
- Persistency - If the web server goes down, all statistics are lost.
- Scalability - The web server gathers statistics by polling each component. This approach is not scalable, and does not behave well on large clusters.
To overcome these limitations, XAP provides a powerful and versatile framework for reporting metrics - each component can report its own metrics (or even user-defined metrics) to any database or tool the user favours by implementing a metrics reporter. In addition, XAP provides a built-in reporter for InfluxDB and integration with Grafana to provide metrics storage and visualization:
- InfluxDB is an open-source distributed time-series database with a powerful query language.
- Grafana is a graph and dashboard builder for visualizing time-series metrics, which supports InfluxDB (and other data sources).
Once enabled, XAP reports metrics to InfluxDB, and the Web Management Console provides an embedded Grafana view in the Monitoring tab, as well as automatic creation of dashboards in Grafana whenever a new Processing Unit is deployed.
Setup
InfluxDB and Grafana are both open-source and free, but are not bundled in XAP distribution. Installation is straight-forward, as described below. Note that XAP’s default metrics configuration is set to match the default settings of InfluxDB and Grafana, so if this is your first time we recommend sticking with the defaults to simplify the process.
Installation
- InfluxDB (0.9 or later) - Download here and follow the installation instructions.
- Grafana (2.5 or later) - Download here, and follow the installation instructions.
Configuration
XAP’s metrics configuration is located at [XAP_HOME]/config/metrics/metrics.xml. Assuming you’ve installed InfluxDB and Grafana without changing the defaults, all you need to do is uncomment the InfluxDB reporter and grafana elements, as shown below:
<metrics-configuration>
    <reporters>
        <reporter name="influxdb">
            <property name="host" value="localhost"/>
            <property name="database" value="mydb"/>
        </reporter>
    </reporters>
    <grafana url="http://localhost:3000" api-key="" user="admin" password="admin">
        <datasources>
            <datasource name="xap">
                <property name="type" value="influxdb"/>
                <property name="isDefault" value="true"/>
                <property name="url" value="http://localhost:8086"/>
                <property name="database" value="mydb"/>
                <property name="access" value="proxy"/>
            </datasource>
        </datasources>
    </grafana>
</metrics-configuration>
reporter- InfluxDB installation automatically creates a database calledmydb, which matches the default. See InfluxDB Reporter for information about other optional settings.grafana- Grafana installation defaults to port3000with username/passwordadmin/admin. In production you’ll probably change those in Grafana, so make sure to change them inmetrics.xmlas well. Even better, you can generate an API key in Grafana and place it in theapi-keyattribute.datasource- This tells Grafana how to connect to your InfluxDB database. Note that InfluxDB uses port8086by default for an API endpoint, and that we’re connecting to the defaultmydbdatabase.
Some InfluxDB packages do not automatically create the default mydb database. we recommend you use the InfluxDB Web Admin or shell to check if it exists, and create it if needed. For more info see Getting Started with InfluxDB.
Getting Started
Once you’ve installed InfluxDB and Grafana and configured metrics.xml, start the Web Management Console and navigate to the Monitoring tab - you’ll see Grafana’s home page (you’ll probably get a login page on the first time - just type in the default admin/admin, and you’ll get the home page):
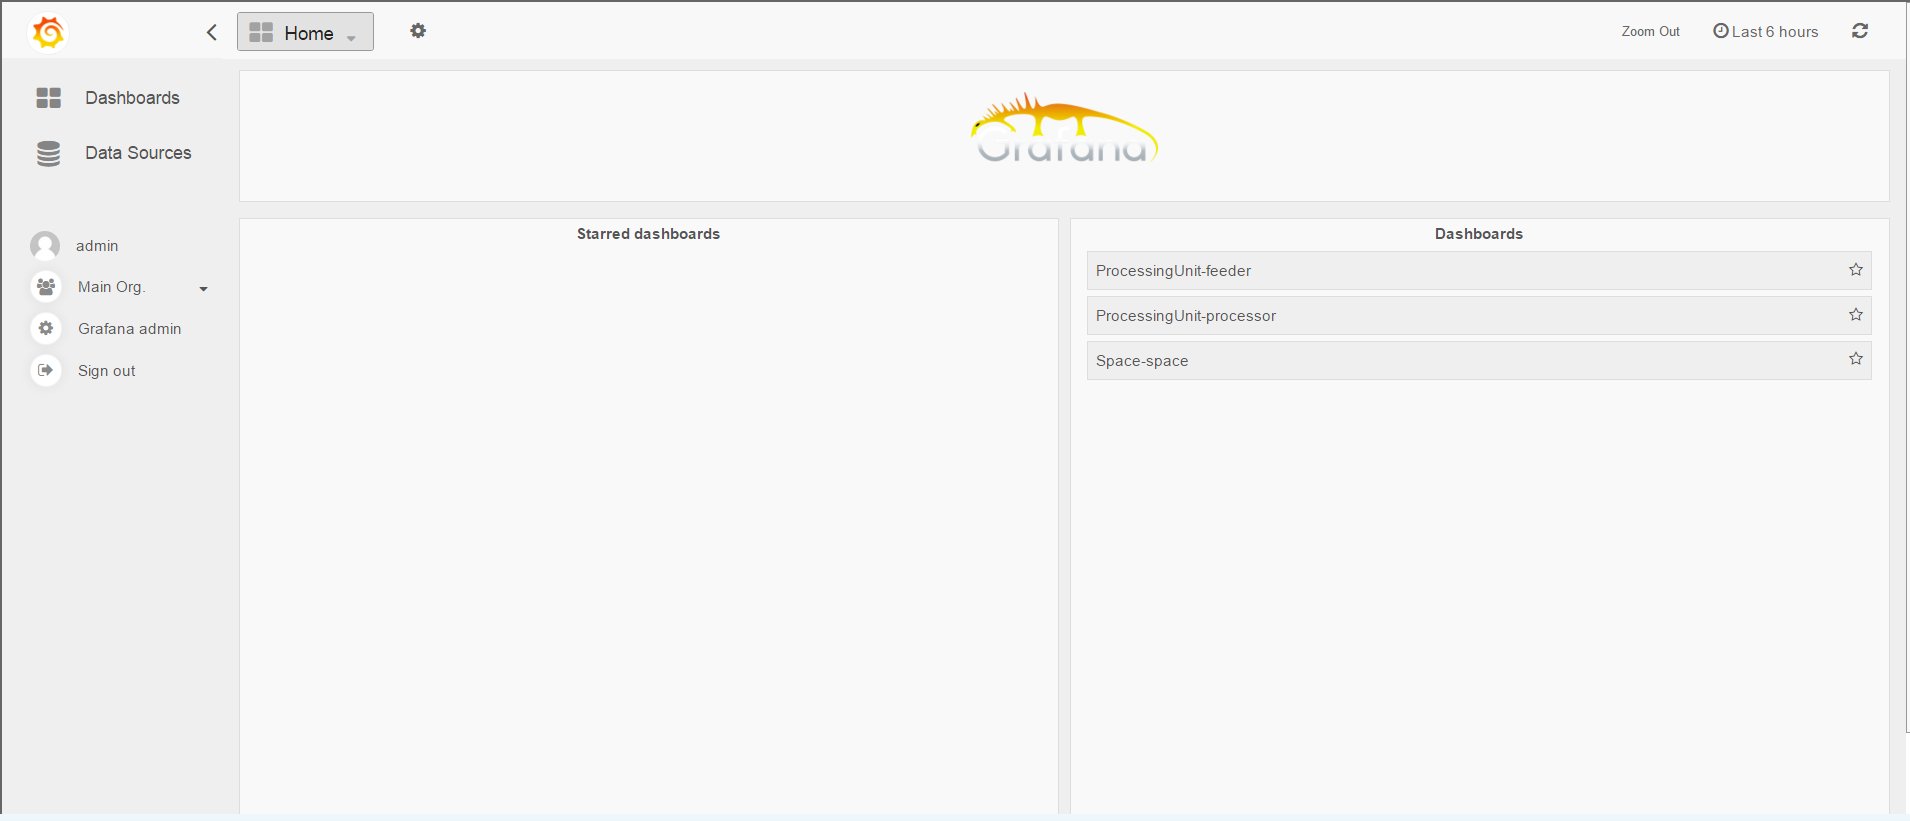
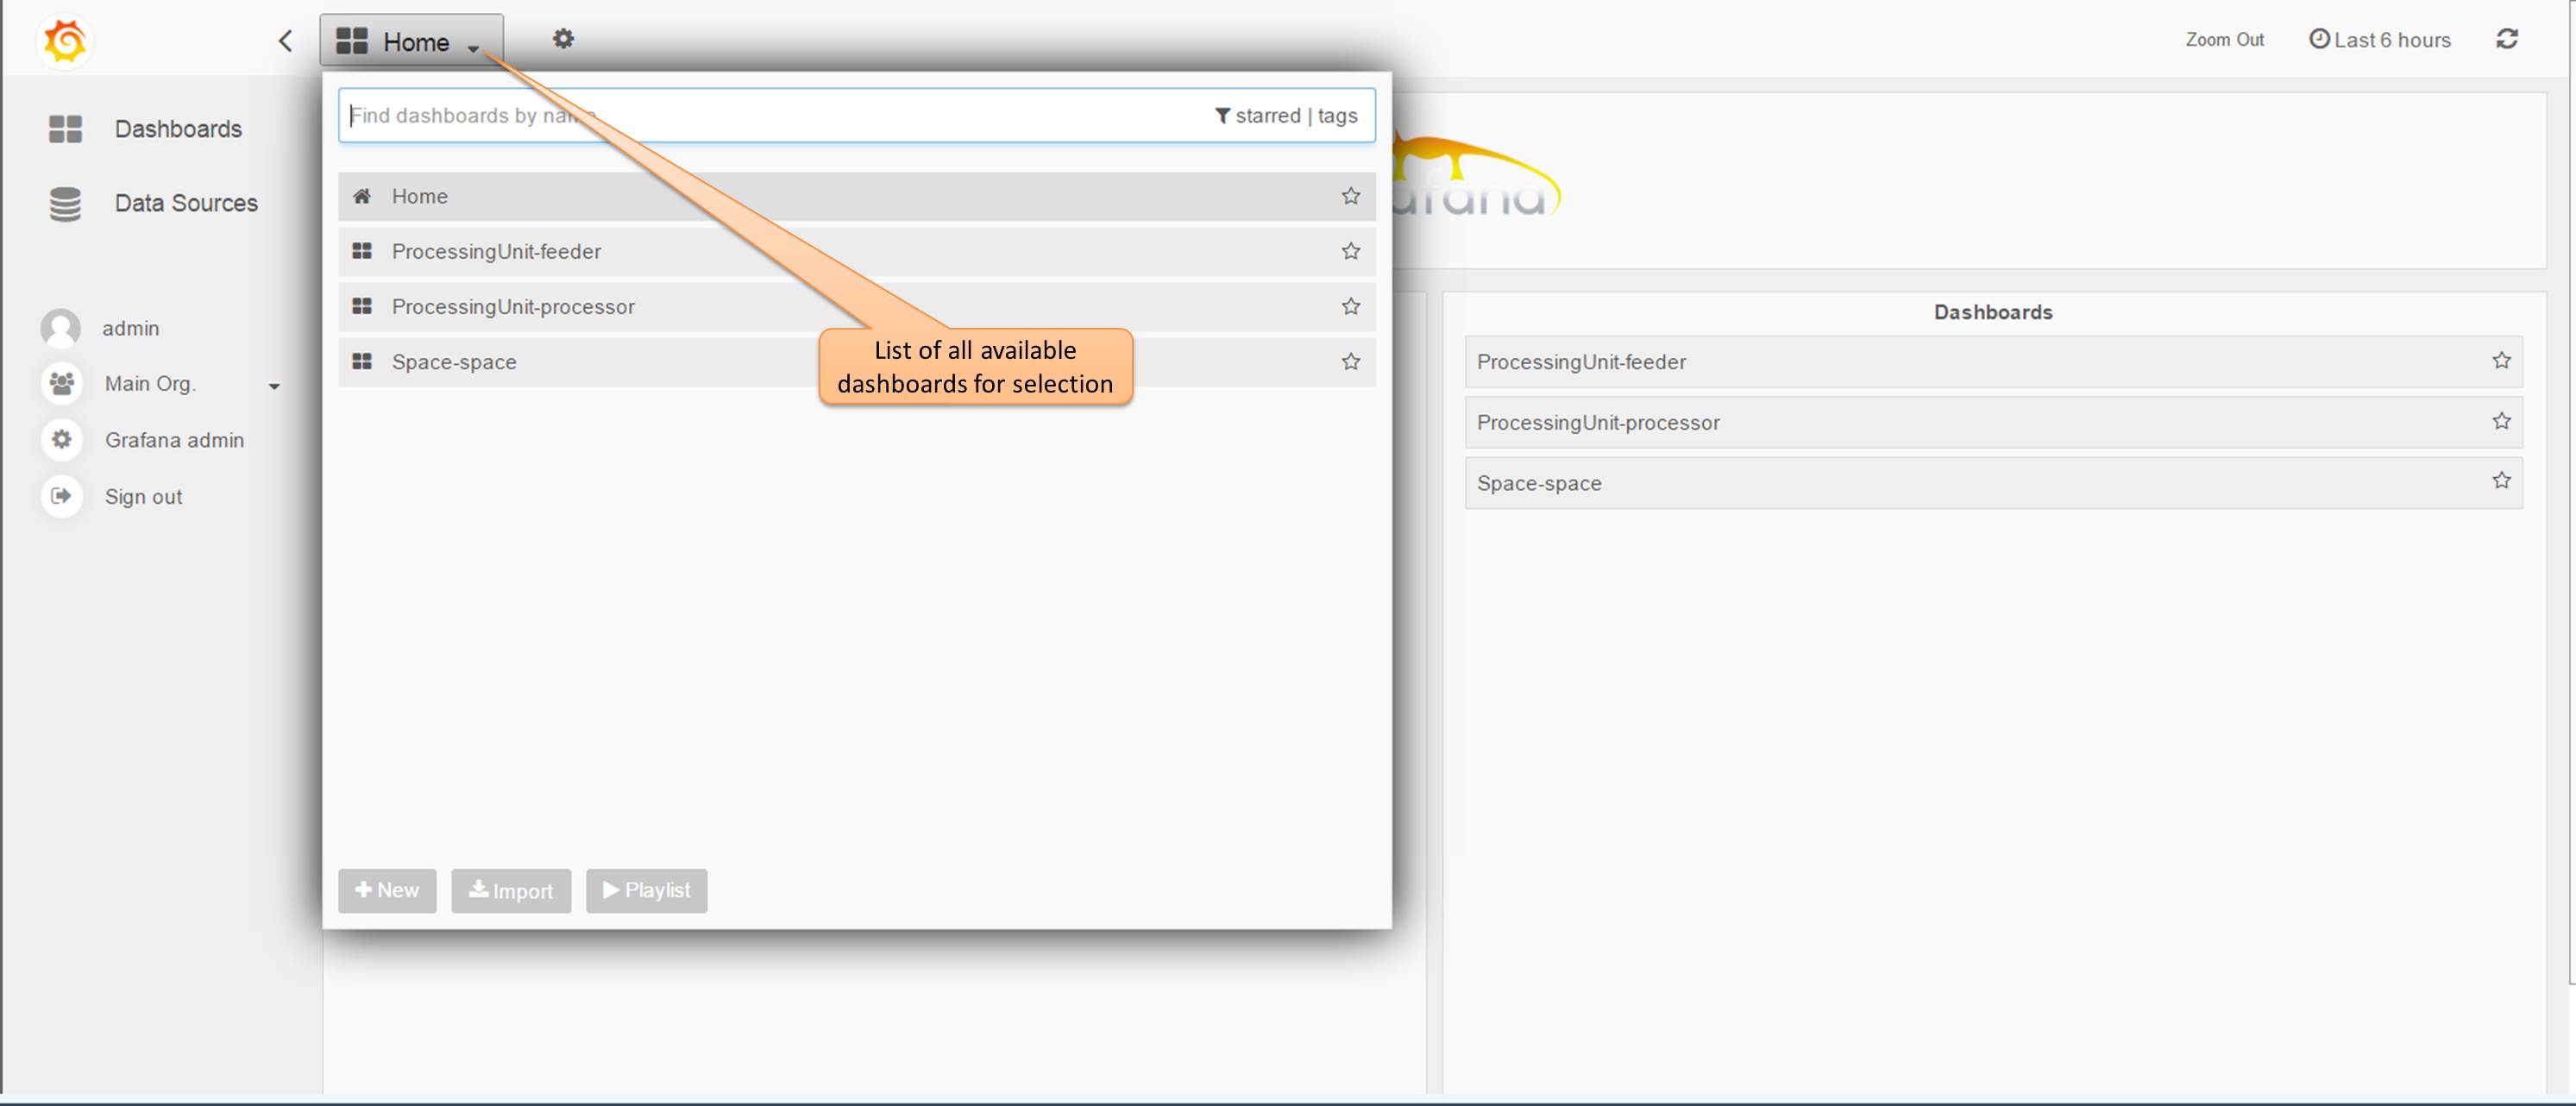
Since we haven’t deployed anything yet, the Dashboards list is empty. Go ahead and deploy a space or any other processing unit - you’ll notice a default dashboard is created for each processing unit and space, with graphs showing commonly used metrics.
Dashboards
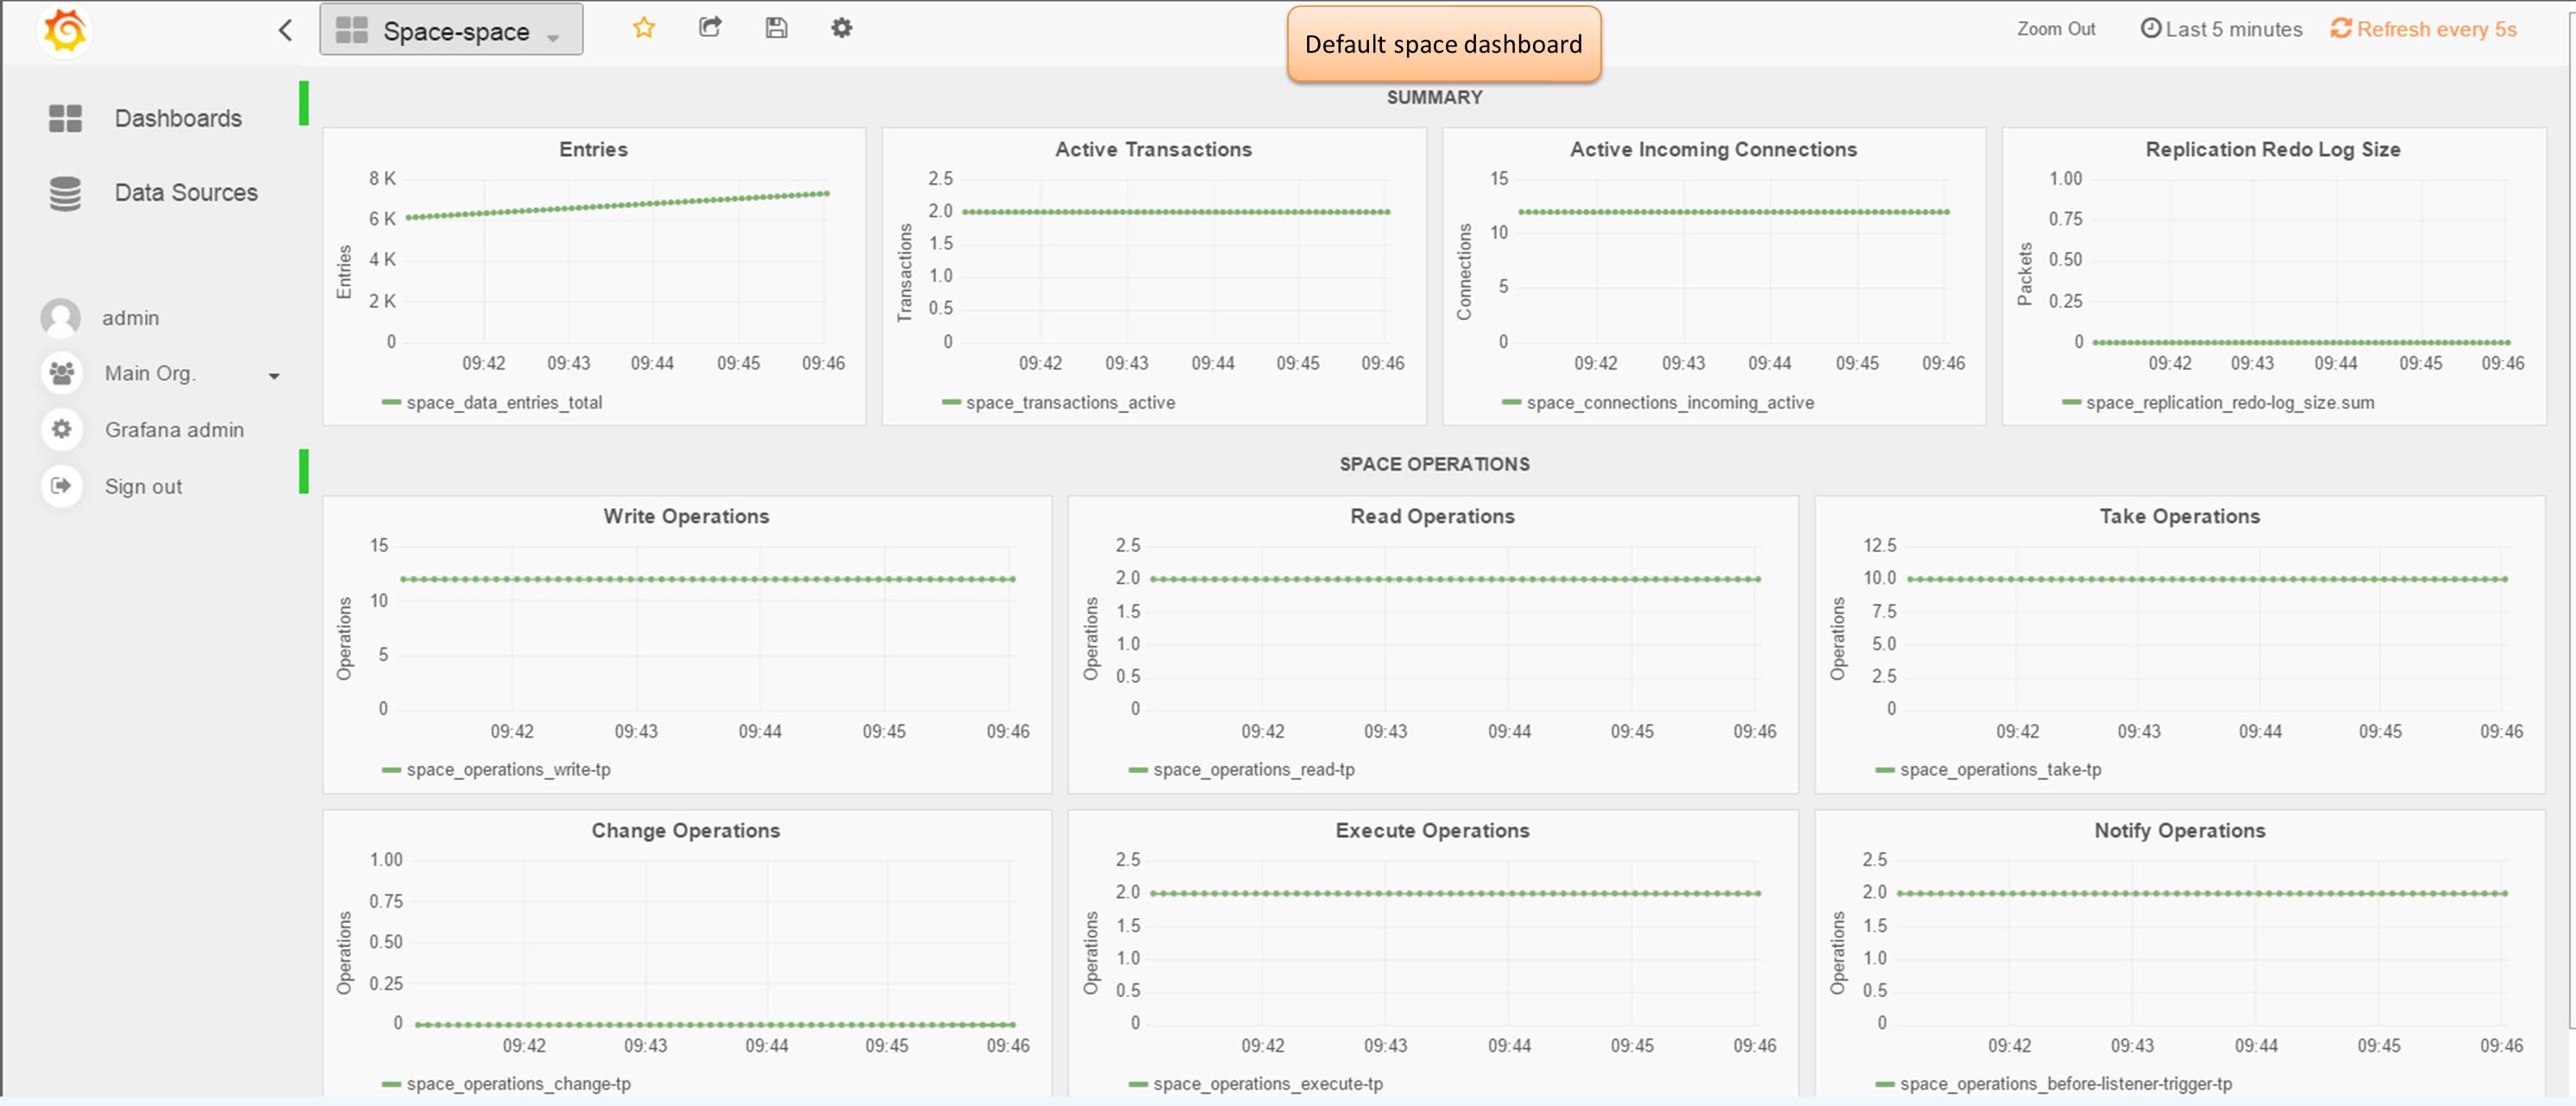
Default Space dashboard
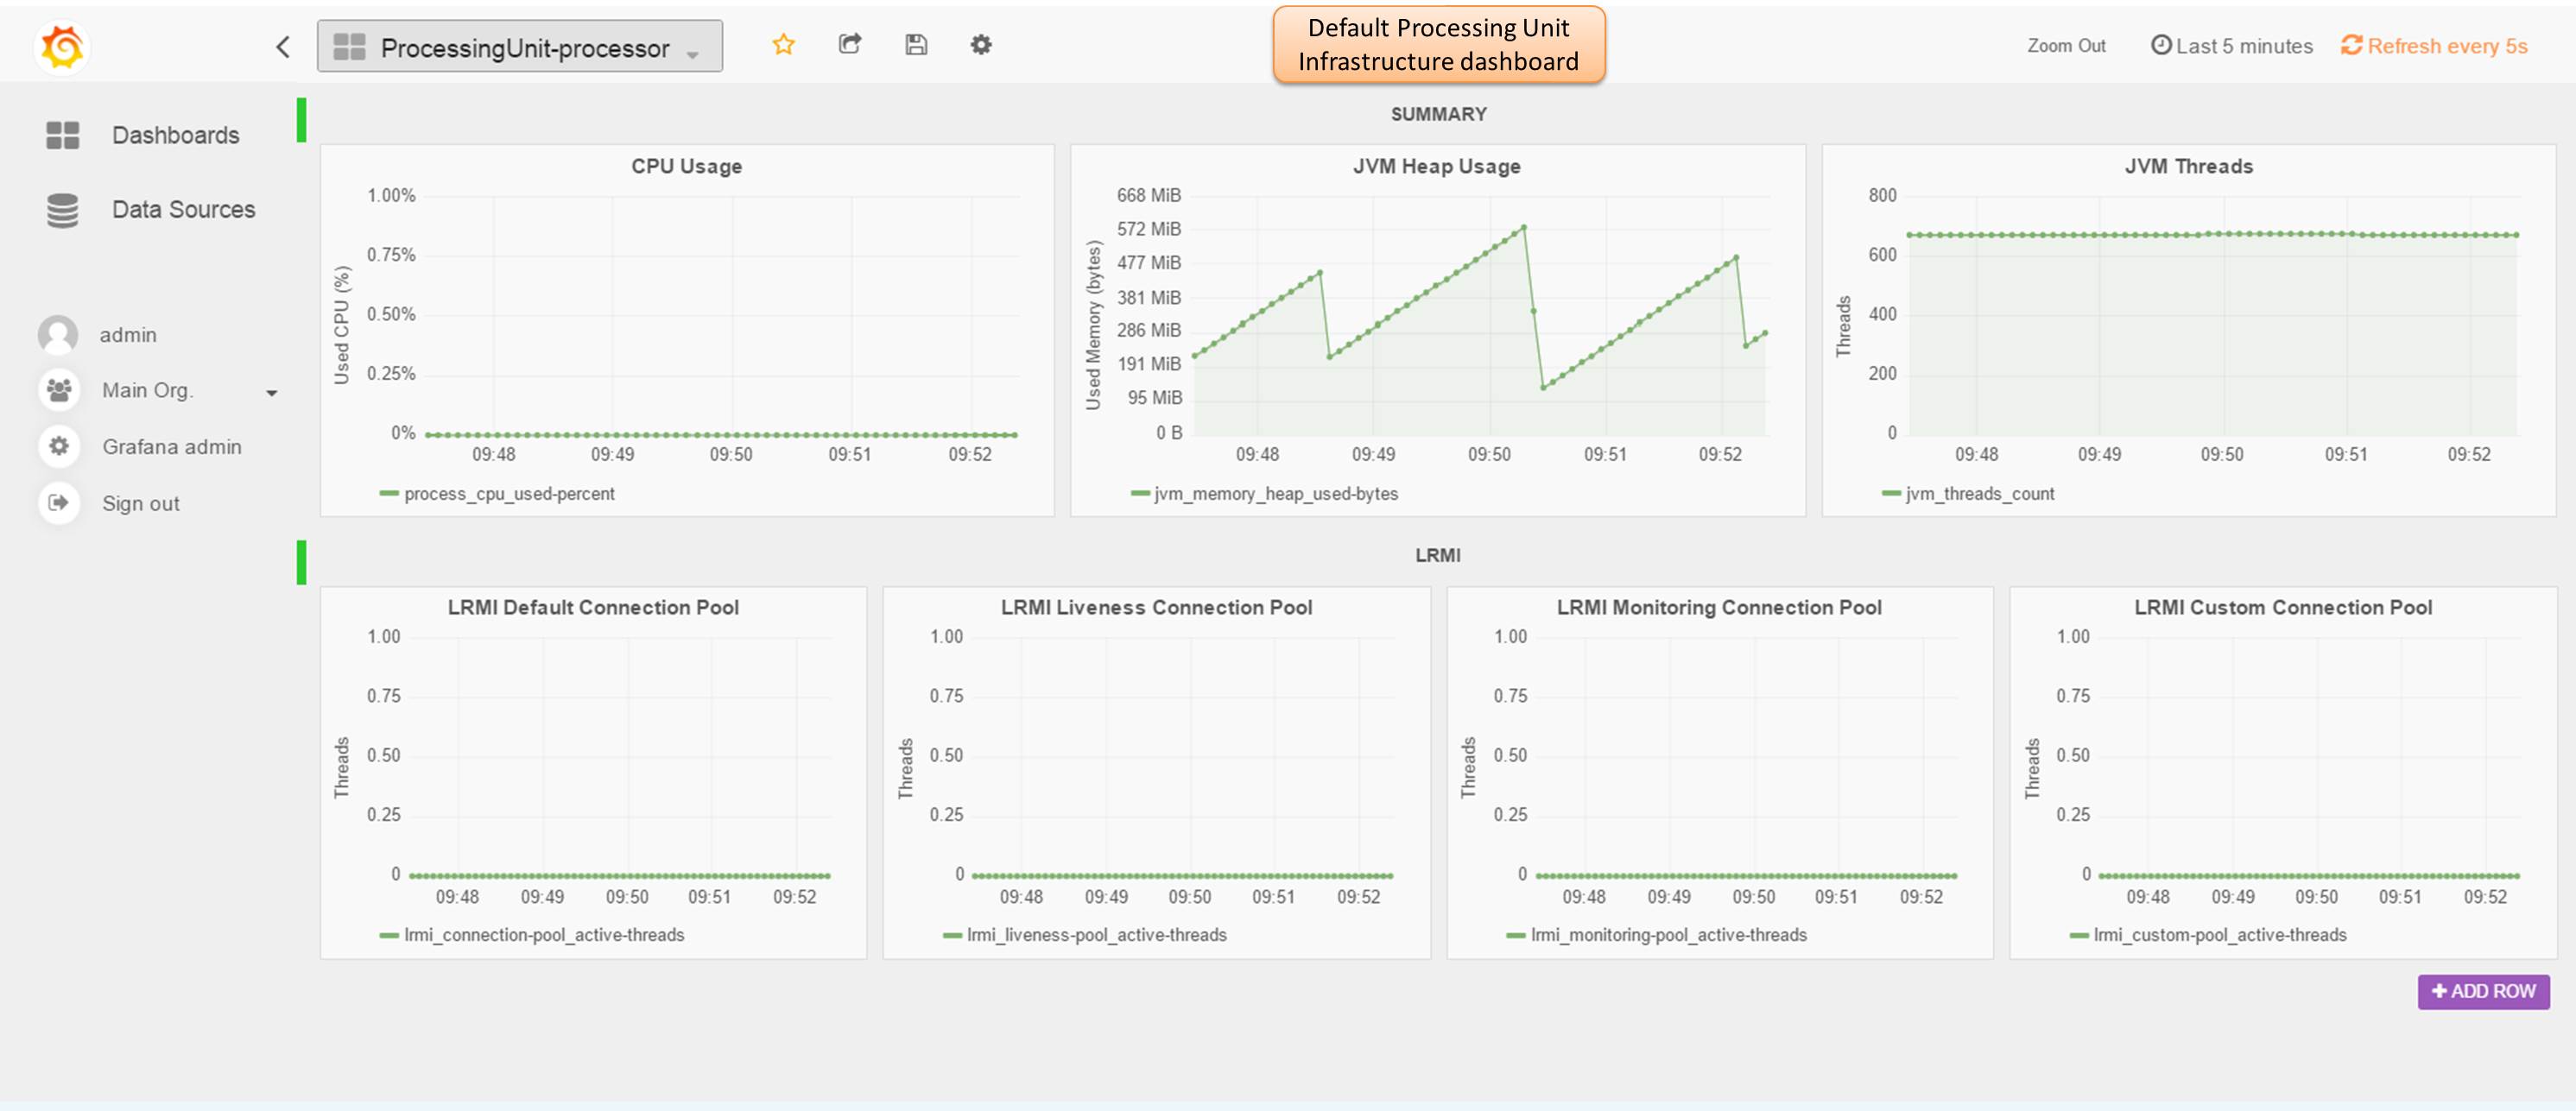
Default Processing Unit dashboard