Network Monitoring
Some of the features discussed on this page are not part of the open-source edition, and are only available in the licensed editions (starting with XAP Premium).
Monitoring network and usage activity during runtime gives you the ability to track which client is invoking which methods on each service (e.g a space serving remote client request such as read/write). Which can be very useful to identify issues, such as which remote proxy is causing a high load on a specific space. Or investigating version conflicts and so on. This monitoring exposes the details for both inbound and outbound communication, allowing you to track the activity of the remote clients on services hosted on a specific Jvm, or alternatively track the activity of the proxies in a specific Jvm on remote services.
Enabling LRMI Monitoring
The monitoring itself is not enabled by default since it introduces some overhead (though not significant) to the system which needs to monitor and track and incoming and outgoing lrmi invocations. In order to enable the monitoring there are three ways to do so:
System Property
Up front by providing a system property when starting the relevant components (Gs-agent, Grid service Manager/Container) - the following system property ‘com.gs.transport_protocol.lrmi.monitorActivity=true’ should be set in order to do so.
API
Using the Admin API during runtime you can enable or disable the LRMI monitoring, for example enabling LRMI monitoring for Jvms hosting a specific processing unit.
Admin admin = new AdminFactory().addGroup("myGroup").createAdmin();

// wait a bit for components to be discovered (or use waitFor) ...

ProcessingUnit processingUnit = admin.getProcessingUnits().waitFor("myProcesingUnit");

// wait for all instances
processingUnit.waitFor(processingUnit.getNumberOfInstances());

for(ProcessingUnitInstance puInstance : processingUnit)
{
  puInstance.getTransport().getLRMIMonitoring().enableMonitoring();
}
JMX
For GSC that contains a space instance, you can also access the GSC via JMX using JConsole for instance and enable or disable the LRMI monitoring as shown in the image.
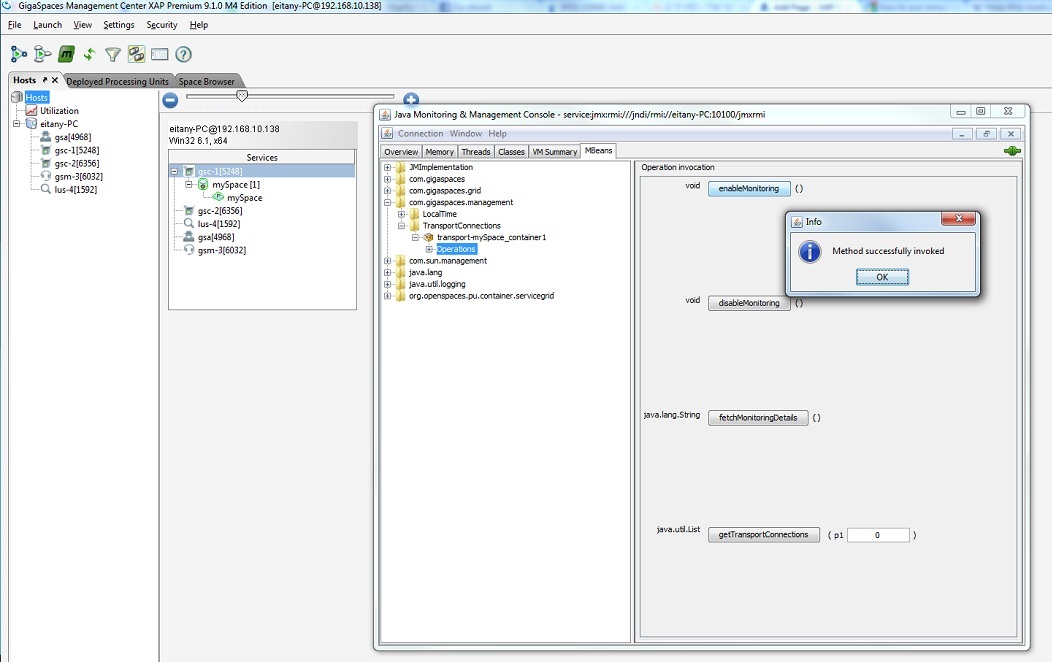
Note that when enabling it via JMX it will enable the monitoring for the entire Jvm and not just the space that was used to enable the monitoring.
Retrieving LRMI Monitoring Details
There are three ways to retrieve the LRMI monitoring details, all of which requires that the relevant Jvm will have the LRMI monitoring enabled which as done as described previously.
Using Dump
When generating a Dump and the LRMI monitoring is enabled if the network dump is selected then the dump will include the LRMI monitoring details. When generating the dump it should include the Network Dump in it in order to contain the LRMI monitoring details. In the generated dump the ‘network.txt’ file will include, among other things, the LRMI monitoring details and it will look similar to this:
===== LRMI =====
Bind Host [my-PC], Port [61174]
Threads: Min [1], Max [128], Active [0]
Work Queue: Size [0], Completed [10084]
Exported Services Inbound Monitoring Details:
LRMIServiceTrackingDetails (ServiceDetails=class com.gigaspaces.grid.gsc.GSCImpl ServiceClassLoaderDetails=GSC
RemoteObjectId=800938341788765
 ConnectionUrl=NIO://my-PC:61174/pid[9768]/800938341788765_2_5863825252831098999_details class com.gigaspaces.grid.gsc.GSCImpl
    /192.168.10.138 pid:7464:
        LRMIServiceClientTrackingDetails (TotalReceivedTraffic=15.99 kilobytes TotalGeneratedTraffic=16.46 kilobytes TotalTraffic=32.45 kilobytes ClientVersion=9.5.0.7495-210)
        org.jini.rio.core.provision.ServiceBeanInstantiator.getServiceRecords: invoked count=1 received traffic=15.99 kilobytes generated traffic=16.46 kilobytes total traffic=32.45 kilobytes

    /192.168.10.138[pid:4672]:
        LRMIServiceClientTrackingDetails (TotalReceivedTraffic=3.6 kilobytes TotalGeneratedTraffic=27.91 kilobytes
TotalTraffic=31.51 kilobytes ClientVersion=9.5.0.7495-210)
        org.jini.rio.core.MonitorableService.ping: invoked count=3 received traffic=3.43 kilobytes generated
traffic=27.89 kilobytes total traffic=31.32 kilobytes
        com.gigaspaces.security.service.SecuredService.isServiceSecured: invoked count=1 received traffic=36 bytes generated traffic=17 bytes total traffic=53 bytes

LRMIServiceTrackingDetails (ServiceDetails=class org.openspaces.pu.container.servicegrid.PUServiceBeanImpl
ServiceClassLoaderDetails=mySpace [1] RemoteObjectId=800938341788776
 ConnectionUrl=NIO://my-PC:61174/pid[9768]/800938341788776_3_5863825252831098999_details[class org.openspaces.pu.container.servicegrid.PUServiceBeanImpl])
    /192.168.10.138[pid:4672]:
        LRMIServiceClientTrackingDetails (TotalReceivedTraffic=2.75 kilobytes TotalGeneratedTraffic=20.24
kilobytes TotalTraffic=23 kilobytes ClientVersion=9.5.0.7495-210)

    /192.168.10.138[pid:7464]:
        LRMIServiceClientTrackingDetails (TotalReceivedTraffic=705 bytes TotalGeneratedTraffic=6.4 kilobytes
TotalTraffic=7.09 kilobytes ClientVersion=9.5.0.7495-210)
        org.openspaces.pu.container.servicegrid.PUServiceBean.isAlive: invoked count=6 received traffic=705
bytes generated traffic=6.4 kilobytes total traffic=7.09 kilobytes

LRMIServiceTrackingDetails (ServiceDetails=class com.gigaspaces.internal.server.space.SpaceImpl(mySpace_container1:mySpace) ServiceClassLoaderDetails=mySpace [1] RemoteObjectId=800938341788774
 ConnectionUrl=NIO://my-PC:61174/pid[9768]/800938341788774_3_5863825252831098999_details[class com.gigaspaces.internal.server.space.SpaceImpl(mySpace_container1:mySpace)])
    /192.168.10.138[pid:4672]:
        LRMIServiceClientTrackingDetails (TotalReceivedTraffic=2.66 megabytes TotalGeneratedTraffic=839.08
kilobytes TotalTraffic=3.48 megabytes ClientVersion=9.5.0.7495-210)
        write: invoked count=10000 received traffic=2.66 megabytes generated traffic=633.93 kilobytes total
traffic=3.28 megabytes
        com.j_spaces.core.admin.IRemoteJSpaceAdmin.ping: invoked count=7 received traffic=1.34
kilobytes generated traffic=171.45 kilobytes total traffic=172.78 kilobytes
        com.sun.jini.start.ServiceProxyAccessor.getServiceProxy: invoked count=1 received traffic=40
bytes generated traffic=23.11 kilobytes total traffic=23.15 kilobytes
        net.jini.admin.Administrable.getAdmin: invoked count=2 received traffic=36 bytes generated traffic=9.39
kilobytes total traffic=9.42 kilobytes
        registerTypeDescriptor: invoked count=1 received traffic=1.21 kilobytes generated traffic=180
bytes total traffic=1.39 kilobytes
        getTypeDescriptor: invoked count=2 received traffic=382 bytes generated traffic=987
bytes total traffic=1.34 kilobytes
        com.gigaspaces.internal.server.space.IRemoteSpace.snapshot: invoked count=1 received traffic=930
 bytes generated traffic=9 bytes total traffic=939 bytes
        com.gigaspaces.internal.remoting.RemoteOperationsExecutor.isActive: invoked count=1 received traffic=32
bytes generated traffic=56 bytes total traffic=88 byte

Proxies Outbound Monitoring Details:
LRMIProxyMonitoringDetails (ServiceDetails=class org.jini.rio.resources.servicecore.LandlordLessor TotalReceivedTraffic=106
bytes TotalGeneratedTraffic=398 bytes TotalTraffic=504 bytes
 ConnectionUrl=NIO://my-PC:61270/pid[7464]/800945862323286_2_1608754746750993212_details[class org.jini.rio.resources.servicecore.LandlordLessor] ServiceVersion=9.5.0.7495-210)
        com.sun.jini.landlord.Landlord.renew: invoked count=1 received traffic=106 bytes generated traffic=398
bytes total traffic=504 bytes

LRMIProxyMonitoringDetails (ServiceDetails=class com.sun.jini.reggie.GigaRegistrar TotalReceivedTraffic=29.55
kilobytes TotalGeneratedTraffic=133.5 kilobytes TotalTraffic=163.05 kilobytes
 ConnectionUrl=NIO://my-PC:61289/pid[10352]/800945908181499_2_8726489250955775913_details[class com.sun.jini.reggie.GigaRegistrar] ServiceVersion=9.5.0.7495-210)
        com.sun.jini.reggie.Registrar.renewServiceLease: invoked count=8 received traffic=22.21
kilobytes generated traffic=83.21 kilobytes total traffic=105.41 kilobytes
        com.sun.jini.reggie.Registrar.modifyAttributes: invoked count=2 received traffic=18
bytes generated traffic=1.22 kilobytes total traffic=1.24 kilobytes
        net.jini.lookup.DiscoveryAdmin.getMemberGroups: invoked count=12 received traffic=636
bytes generated traffic=432 bytes total traffic=1.04 kilobytes
        com.sun.jini.reggie.Registrar.renewLeases: invoked count=1 received traffic=53
bytes generated traffic=238 bytes total traffic=291 bytes
API
Using the Admin API, you can retrieve the monitoring details as typed classes, following the above example you can get LRMI monitoring of Jvms hosting a specific processing unit.
Admin admin = new AdminFactory().addGroup("myGroup").createAdmin();

// wait a bit for components to be discovered (or use waitFor) ...

ProcessingUnit processingUnit = admin.getProcessingUnits().waitFor("myProcesingUnit");

// wait for all instances
processingUnit.waitFor(processingUnit.getNumberOfInstances());

for(ProcessingUnitInstance puInstance : processingUnit)
{
  LRMIMonitoringDetails monitoringDetails = puInstance.getTransport().getLRMIMonitoring().fetchMonitoringDetails();
  LRMIOutboundMonitoringDetails outboundDetails = monitoringDetails.getOutboundMonitoringDetails();
  LRMIInboundMonitoringDetails inboundDetails = monitoringDetails.getInboundMonitoringDetails();
  // ... do something with the details
}
The details included by API are exactly the same as shown in the network dump, as a matter of fact, the network dump is simply the toString() of the LRMIMonitoringDetails class
JMX
JMX can also be accessed to get the details, however in a digested string format which looks like the content of the network dump file, this can be done via JConsole in the same way you enable the LRMI monitoring, you invoke the fetchMonitoringDetails operation instead.
Monitoring Content
As showed in the above dump file, the monitoring details contains the following:
Inbound
- List of hosted service their details and inbound invocation details.
- Per service, showing details of each connected remote client invocation details, including its address, version etc’.
- client invocation details including information about which methods were invoked by the client, network traffic generated by the client etc’.
Outbound
- List of proxies and their details and outbound invocation details.
- Per proxy, showing invocation details including information about which methods were invoked by the client, network traffic generated by the client etc’.
The monitoring details contains only data for active client, there history is not preserved. Which means that inbound invocations of clients that are no longer connected to the server or outbound invocations of proxies that do no longer exist will not be part of the monitoring details. In order to track history one need to actively collect the monitoring details and persist them somewhere else. However, keep in mind that getting the details all the time require the LRMI monitoring to be enabled throughout the entire monitoring period. And fetching the details themselves may introduce network overhead when there are many clients involved.