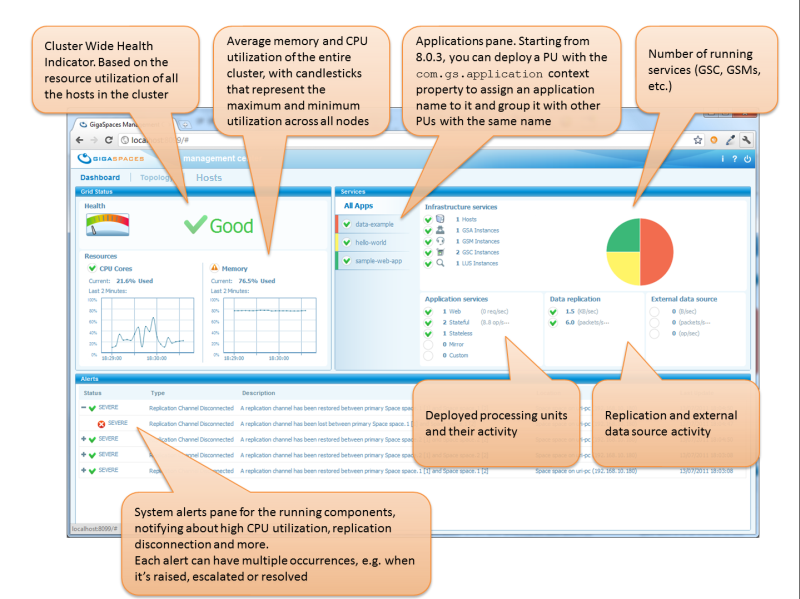
Dashboard View
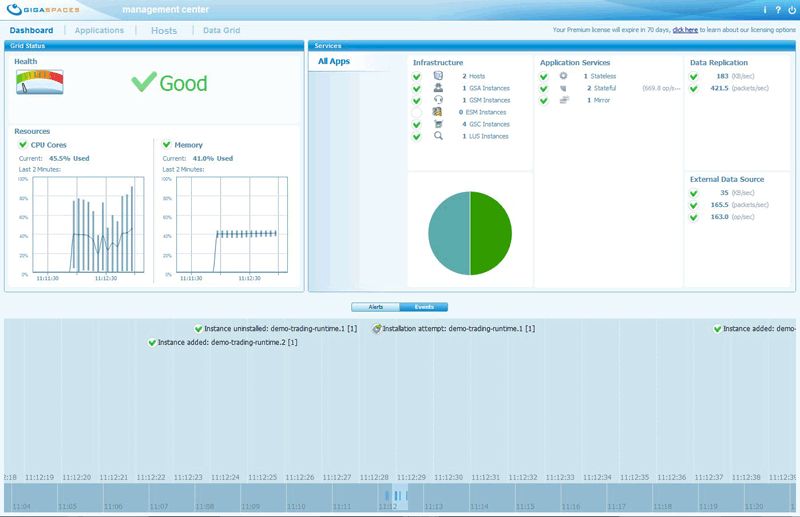
Once you’ve passed the login screen, you will enter the main dashboard screen. The dashboard gives you a single click view of the entire cluster, including alerts on various problematic conditions. Please refer the image below and the call-outs in it for more details:
Alerts panel
The Alerts panel displays XAP Alert groups (Alerts are grouped by correlation key) for more details see Administrative Alerts
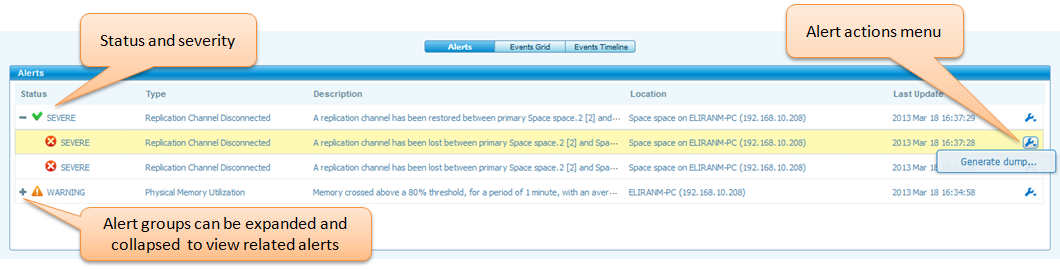
Alerts dump
A logs dump can be retrieved for the alert’s related grid components. This can be done by opening the Alert Actions menu and clicking “Generate dump…”, after which, a window will appear providing configuration of the dump:
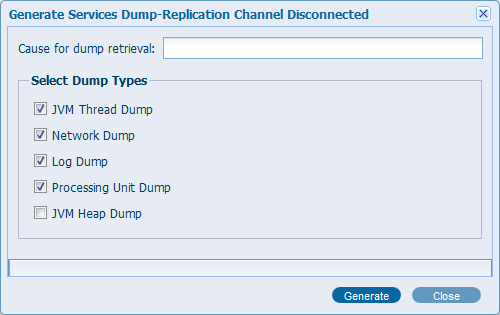
Select the desired components for the dump and click “Generate”, and a zip file will be downloaded containing log files for each of the selected components.
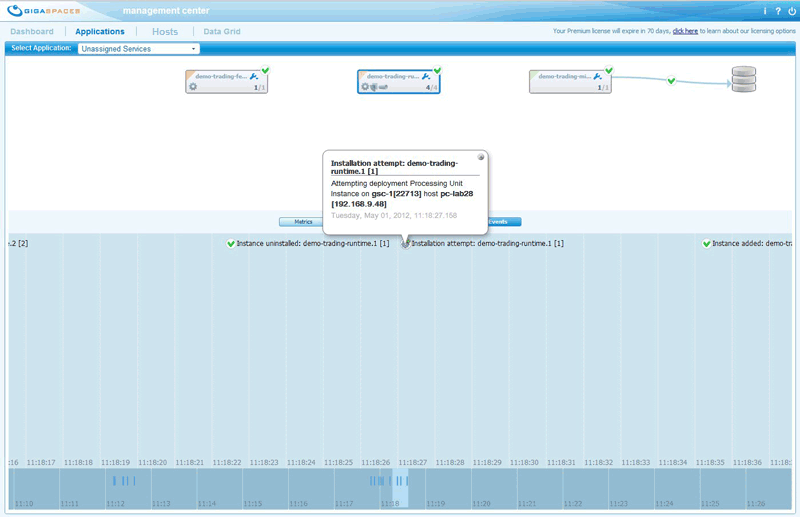
Events time-line panel
At the bottom panel of the web dashboard, the events time line is displayed upon selection of the “Events” tab. The events time-line shows the deployment life cycle of all the processing units. To filter by application, the events time line is also available in the Application tab. (see Application View)
Life-cycle success events for each instance:
- installation attempt : an attempt to provision a processing unit instance on an available GSC
- instance added: a processing unit instance has successfully been instantiated on a GSC
- instance uninstalled: a processing unit instance has been successfully removed
- Container N/A: a processing unit instance is pending instantiation until an available GSC is discovered
Life-cycle success events for processing unit:
- installation succeeded: deployment of processing unit has been completed successfully (all instances instantiated)
- installation uninstalled: undeployment of processing unit has been completed (all instances undeployed)
Life-cycle failure events for each instance:
- installation failed: processing unit instance has failed to instantiate
- installation unresponsive: processing unit instance is unresponsive to “member-is-alive” attempts (suspecting failure)
- installation crashed: processing unit instance unresponsiveness has timed-out (detected failure)
- installation re-detected: processing unit instance was previously unresponsive but is now responsive.
Click each event to get a tooltip with more information.