Moving into Production Checklist
The following list should provide you with the main activities to be done prior moving your system into production. Reviewing this list and executing the relevant recommendations should result in a stable environment with a low probability of unexpected behavior or failures that are result of a GigaSpaces XAP environment misconfiguration.
In general, XAP runs on every OS supporting the JVM technology (Windows, Linux, Solaris, AIX, HP, etc). See below tuning and configuration recommendations that most of the applications running on GigaSpaces XAP might need.
Monitoring
Having reliable monitoring functionality tracking XAP and its surroundings is an important task to be completed before moving into production. Correctly monitoring the XAP environment will allow you to proactively take actions (manually/ automatically) before any system failure avoiding bad user experience, data loss or abnormal sudden system shutdown. You may identify an increase with the system usage to allocate additional CPU or memory resources, or identify broken components to be addressed before these actually impact system health or correct system behavior.
The monitoring functionality should track the following:
- Service Grid statistics
- Data Grid statistics
- Event Containers (Polling / Notify / Archiver) statistics
- Remote Service statistics
- Remote communication statistics
- Client Local cache / view statistics
- Web application statistics
- Mirror Service statistics
- Replication statistics
- Admin Alerts (CPU Utilization, Garbage Collection Alert, Replication Channel Disconnection Alert , etc)
- Log files
For all service grid components (GSA , LUS , GSM , GSC) you should monitor Thread count , CPU utilization, file descriptors count , memory utilization and network utilization.
You may publish this information in real-time to any enterprise monitoring system you may have (CA Wily introscope, HP Operations Manager , IBM Tivoli , etc) to be correlated with your existing application monitoring. You may also generate daily / hourly reports of this information to be shared with relevant entities within your organization to be processed offline to estimate required system capacity and size upon system growth.
Please approach GigaSpaces support team for Monitoring tools provided as part of GigaSpaces professional services. These can be adapted to fit your exact requirements.
File Descriptors
The XAP LRMI communication layer opens network connections dynamically. With large scale applications or with clients that are running a large number of threads accessing the Data-Grid, you might end up having a large number of file descriptors used both on the client and server side. You might have multiple JVMs running on the machine. This might need to increase the default max user processes value.
On Linux OS - without the right file descriptors settings you will have Too many open files error messages at the XAP processes log files displayed or on the client side. Low file descriptors values will impact application stability and ability for clients to connect to the XAP grid. You will have to set both System level File Descriptor Limit and also Process level File Descriptor Limit to high values to avoid these problems. See below how.
System File Descriptor Limit
To change the number of file descriptors in Linux, do the following as the root user:
Edit the following line in the /etc/sysctl.conf file:
fs.file-max = 300000
300000 will be the new file descriptor limit that you want to set.
Apply the change by running the following command:
/sbin/sysctl -p
Verify your settings using:
cat /proc/sys/fs/file-max
OR
sysctl fs.file-max
Process File Descriptor Limit
The Linux OS by default has a relatively small number of file descriptors available and max user processes (1024). You should make sure that your standalone clients, or GSA/GSM/GSC/LUS using a user account which have its maximum open file descriptors (open files) and max user processes configured to a high value. A good value is 32768.
Setting the max open file descriptors and max user processes is done via the following call:
ulimit -n 32768 -u 32768
Alternatively, you should have the following files updated:
/etc/security/limits.conf

- soft    nofile          32768
- hard    nofile          32768

/etc/security/limits.d/90-nproc.conf

- soft nproc 32768
See increase-open-files-limit for more details.
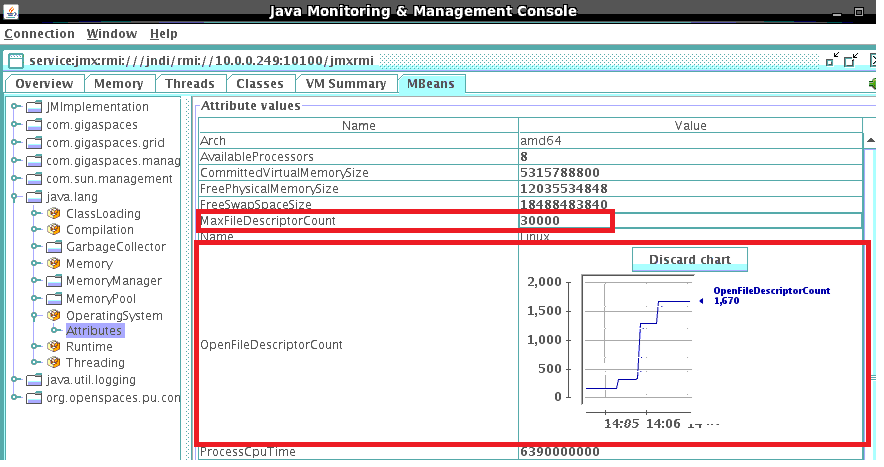
Monitoring Utilized File Descriptors
You can monitor the MaxFileDescriptorCount and OpenFileDescriptorCount with the JConsole:
Sharing Grid Management Services Infrastructure
There are numerous ways allowing different systems/applications/groups to share the same pool of servers (in development or production environment) on the network. A non-exhaustive list of some of the options is delineated below:
Outside of XAP: Dedicated hardware for each group, each set of servers runs an independent XAP runtime environment (aka Service Grid) without sharing the same server between different groups. This naive approach is good for simple or temporary scenarios. In this case each XAP runtime environment is isolated from each other using different LOOKUPLOCATORS or different LOOKUPGROUPS value.
Using Multiple Zones: A single XAP runtime environment spans all servers, where each group of XAP containers (across several machines) are labeled with a specific Zone. You may have multiple Zones used by different containers on the same server. For example, have on server A two containers labeled with zoneX and four containers labeled with zoneY and on server B two containers labeled with zoneX and four containers labeled with zoneY. At deployment time, application services (aka processing Unit) are deployed using a specific Zone. This instructs the system to provision the services into the corresponding containers. Use of multiple Zones breaks logically the runtime environment into different segments.
Using Multiple Lookup Groups (multicast lookup discovery): All servers running multiple XAP runtime environments, where each XAP container using a specific Lookup Group when registering with the Lookup Service. At deployment time, application services (aka processing Unit) are deployed using a specific lookup group. Use of multiple lookup group breaks logically the Infrastructure into different segments. The Lookup Group value controlled via the
LOOKUPGROUPSenvironment variable. When using this option you should make sure multicast is enabled on all machines.Using Multiple Lookup Locators (unicast lookup discovery): All servers running multiple XAP runtime environments, where each XAP container using a specific Lookup locator when registering with the Lookup Service. At deployment time, application services (aka processing Unit) are deployed using a specific lookup locator. Use of multiple lookup locators breaks logically the Infrastructure into different segments. If you have multiple lookup services running on the same server, each will use a different listening port. You may control this port using the
com.sun.jini.reggie.initialUnicastDiscoveryPortsystem property. The Lookup Locators value controlled via theLOOKUPLOCATORSenvironment variable.Using a shared XAP runtime environment: A single XAP runtime environment spans all servers, with no use of Zones or Lookup Groups/Locators. Application services share the servers and allocation done in a random manner without using any pre-defined segmentation.
For any of the above options, XAP exposes the ability to control a deployed application service in run-time, such that new application service instances can be created or existing instances can be relocated. This tight operational control enables even more creative resource sharing possibilities.
Devising the appropriate resource sharing strategy for your system should consider the breadth of operational requirements and application services’ characteristics. For example, two applications with variable load may run into trouble running on a fixed-size shared environment if peak loads coincide. XAP provides consultancy services for the environment planning stage that addresses the above as well as other considerations impacting your environment. For more information see GigaPro Services
Binding the Process into a Machine IP Address
In many cases, the machines that are running GigaSpaces XAP (i.e., a GSA, GSM, or GSC), or running GigaSpaces XAP client applications (e.g., web servers or standalone JVM/.NET/CPP processes) have multiple network cards with multiple IP addresses. To make sure that the XAP processes or the XAP client application processes bind themselves to the correct IP addresses - accessible from another machines - you should use the NIC_ADDR environment variable, or the java.rmi.server.hostname system property. Both should be set to the IP of the machine (one of them in case of a machine with multiple IP addresses). Without having this environment/property specified, in some cases, a client process is not able to be notified of events generated by the XAP runtime environment or the space.
Examples:
export NIC_ADDR=10.10.10.100
./gs-agent.sh &
java -Djava.rmi.server.hostname=10.10.10.100 MyApplication
With the above approach, you can leverage multiple network cards within the same machine to provide a higher level of hardware resiliency, and utilize the network bandwidth in an optimal manner, by binding different JVM processes running on the same physical machine to different IP addresses. One example of this would be four GSCs running on the same machine, where two of the them are using IP_1 and the other two are using IP_2.
For more information, see How to Configure an Environment With Multiple Network-Cards (Multi-NIC)
Ports
GigaSpaces XAP uses TCP/IP for most of its remote operations. The following components within XAP require open ports:
| Service | Description | Configuration Property | Default value |
|---|---|---|---|
| RMI registry listening port | Used as an alternative directory service. | com.gigaspaces.system.registryPort System property |
10098 and above. |
| Webster listening port | Internal web service used as part of the application deployment process. | com.gigaspaces.start.httpPort System property |
9813 |
| Web UI Agent | GigaSpaces XAP Dashboard Web Application. | com.gs.webui.port System property |
8099 |
Here are examples of how to set different LRMI listening ports for the GS-UI, and another set of ports for the GSA/GSC/GSM/Lookup Service:
export EXT_JAVA_OPTIONS=-Dcom.gs.transport_protocol.lrmi.bind-port=7000-7500
export EXT_JAVA_OPTIONS=-Dcom.gs.transport_protocol.lrmi.bind-port=8000-8100
A running GSC tries to use the first free port that is not used out of the port range specified. The same port might be used for several connections (via a multiplexed protocol). If all of the port range is exhausted, an error is displayed.
When there are several GSCs running on the same machine, or several servers running on the same machine, it is recommended that you set a different LRMI port range for each JVM. Having 100 as a port range for the GSCs supports a large number of clients (a few thousand).
LRMI Connection Thread Pool
The default LRMI behavior will open a different connection at the client side and start a connection thread at the server side, once a multithreaded client accesses a server component. All client connections may be shared between all the client threads when communicating with the server. All server side connection threads may be shared between all client connections.
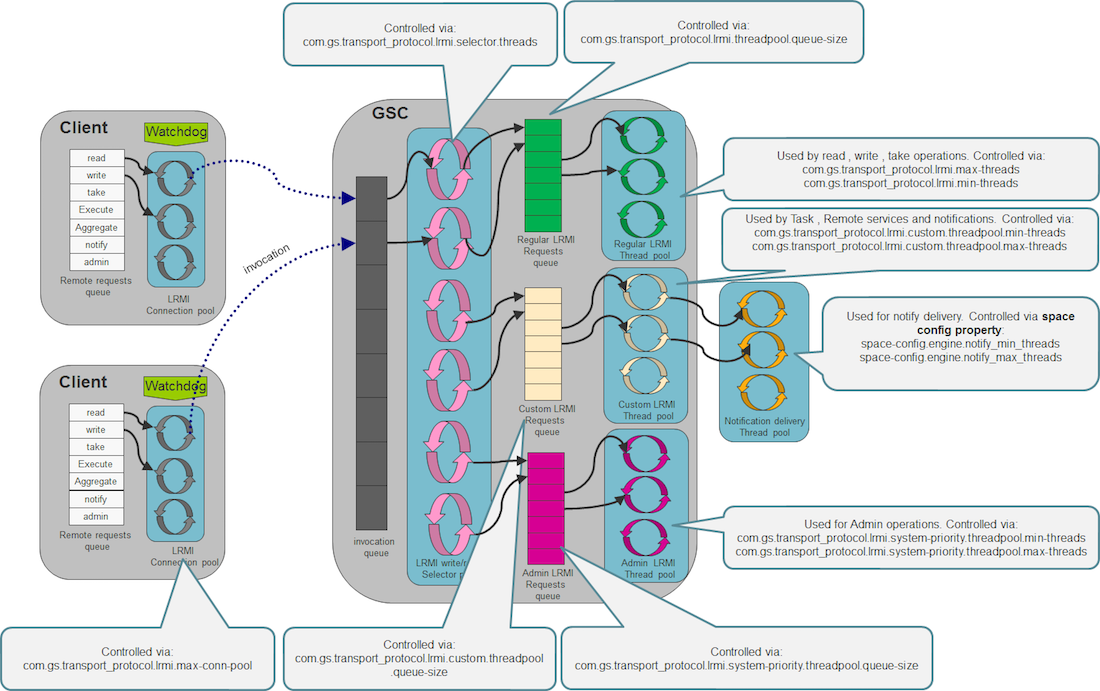
Client LRMI Connection Pool
The client LRMI connection pool is maintained per server component - i.e. by each space partition. For each space partition a client maintains a dedicated connection pool shared between all client threads accessing a specific partition. When having multiple partitions (N) hosted within the same GSC, a client may open maximum of N * com.gs.transport_protocol.lrmi.max-conn-pool connections against the GSC JVM process.
You may need to change the com.gs.transport_protocol.lrmi.max-conn-pool value (1024) to have a smaller number. The default value might be high for application with multiple partitions.
Client total # of open connections = com.gs.transport_protocol.lrmi.max-conn-pool * # of partitions
This may result very large amount of connections started at the client side resulting Too many open files error. You should increase the OS’ max file descriptors amount by calling the following before running the client application (on UNIX):
ulimit -n 65536
or by lowering the com.gs.transport_protocol.lrmi.max-conn-pool value.
Server LRMI Connection Thread Pool
The LRMI connection thread pool is a server side component. It is in charge of executing the incoming LRMI invocations. It is a single thread pool within the JVM that executes all the invocations, from all the clients and all the replication targets.
Lookup Locators and Groups
A space (or any other service, such as a GSC or GSM) publishes (or registers/exports) itself within the Lookup Service. The lookup service acts as the system directory service. The lookup service (aka service proxy) keeps information about each service, such as its location and its exposed remote methods. Every client or service needs to discover a lookup service as part of its bootstrap process.
There are 2 main options for how to discover a lookup service:
- Via locator(s) - Unicast Discovery mode. With this option a specific IP (or hostname) used indicating the machine running the lookup service. This option can be used when multicast communication is disabled on the network, or when you want to avoid the overhead involved with the multicast discovery.
- Via group(s) - Multicast Discovery mode. relevant only when the network supports multicast. This is a “tag” you assign to the lookup. Clients that want to register with this lookup service, or search for a service proxy, need to use this specific group when discovering the lookup service.
To configure the GigaSpaces XAP runtime components (GSA,GSC,GSM,LUS) to use unicast discovery you should set the LOOKUPLOCATORS variable:
export LOOKUPLOCATORS=MachineA,MachineB
./gs-agent.sh &
To configure the GigaSpaces XP runtime components (GSA,GSC,GSM,LUS) to use multicast discovery you should set the LOOKUPGROUPS variable:
export LOOKUPGROUPS=Group1,Group2
./gs-agent.sh &
When running multiple systems on the same network infrastructure, you should isolate these by having a dedicated set of lookup services (and GSC/GSM) for each system. Each should have different locators/groups settings.
Space URL Examples
See below for examples of Space URL you should be familiar with:
jini://localhost/*/space- this space URL means that the client is trying to discover the lookup service on the localhost, together with discovering it on the network via multicast (enabled by default).jini://localhost/*/space?locators=host,host2- this space URL means that together with searching for the lookup service on the localhost or the network, we are looking for it on host1 and host2. We call this unicast lookup discovery.jini://localhost/*/space?groups=A,B- this space URL means that together with searching for the lookup service on the localhost, we are using multicast discovery to search for all the lookup services associated with group A or B.jini://*/*/space- this space URL means that searching for the lookup service is done only via multicast discovery././space?groups=A,B- this space URL means that the started space registers itself with group A and B. To access such a space via a remote client, it needs to use the following space URL:jini://*/*/space?groups=Aorjini://*/*/space?groups=B.
Space Configuration with Unit Tests
When running unit tests, you might want these set up so that no remote client can access the space they are running. This includes regular clients or the GS-UI.
When running a space running in embedded mode and not deployed into a GSC (standalone space), it starts a lookup service automatically. This allows you to access it from the GS-UI.
If it is running within the GSC, it finds the lookup via the LOOKUPLOCATORS or LOOKUPGROUPS settings.
<os-core:embedded-space id="space" name="myspace">
    <os-core:properties>
        <props>
            <prop key="com.j_spaces.core.container.directory_services.jini_lus.start-embedded-lus">false</prop>
            <prop key="com.j_spaces.core.container.directory_services.jini_lus.enabled">false</prop>
            <prop key="com.j_spaces.core.container.directory_services.jndi.enabled">false</prop>
            <prop key="com.j_spaces.core.container.embedded-services.httpd.enabled">false</prop>
        </props>
    </os-core:properties>
</os-core:embedded-space>
The Runtime Environment - GSA, LUS, GSM and GSCs
In a dynamic environment where you want to start GSCs and GSM remotely, manually or dynamically, the GSA is the only component you should have running on the machine that is hosting the XAP runtime environment. This lightweight service acts as an agent and starts a GSC/GSM/LUS when needed.
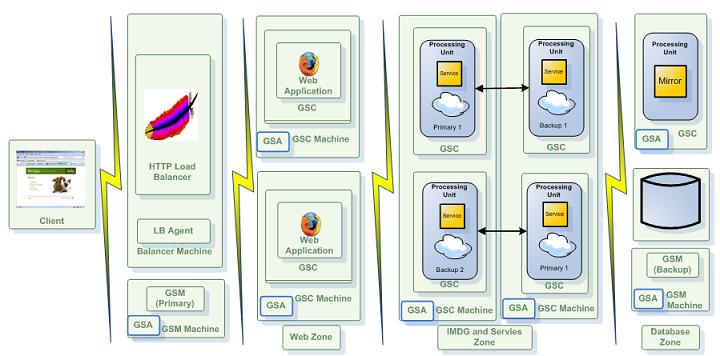
You should plan the initial number of GSCs and GSMs based on the application memory footprint, and the amount of processing you might need. The most basic deployment should include 2 GSMs (running on different machines), 2 Lookup services (running on different machines), and 2 GSCs (running on each machine). These host your Data-Grid or any other application components (services, web servers, Mirror) that you deploy.
In general, the total amount of GSCs you are running across the machines that host the system depends on:
- The amount of data you want to store in memory.
- The JVM maximum heap size.
- The processing requirements.
- The number of users the system needs to serve.
- The total number of CPU cores the machine is running.
A good number for the amount of GSCs a machine should host would be half of the amount of total CPU cores, each having no more than a 10G maximum heap size.
Configuring the Runtime Environment
JVM parameters (system properties, heap settings etc.) that are shared between all components are best set using the EXT_JAVA_OPTIONS environment variable. However, starting from 7.1.1, specific GSA JVM parameters can be easily passed using GSA_JAVA_OPTIONS that will be appended to EXT_JAVA_OPTIONS. If GSA_JAVA_OPTIONS is not defined, the system will behave as in 7.1.0. As a good practice, one can add all components’ environment variables ( GSA_JAVA_OPTIONS, GSM_JAVA_OPTIONS, GSC_JAVA_OPTIONS, LUS_JAVA_OPTIONS) within the GSA script, or in a wrapper script and the values will be passed to corresponding components.
#Wrapper Script
export GSA_JAVA_OPTIONS='-Xmx256m'
export GSC_JAVA_OPTIONS='-Xmx2048m'
export GSM_JAVA_OPTIONS='-Xmx1024m'
export LUS_JAVA_OPTIONS='-Xmx1024m'

#call gs-agent.sh
. ./gs-agent.sh
@rem Wrapper Script
@set GSA_JAVA_OPTIONS=-Xmx256m
@set GSC_JAVA_OPTIONS=-Xmx2048m
@set GSM_JAVA_OPTIONS=-Xmx1024m
@set LUS_JAVA_OPTIONS=-Xmx1024m

@rem call gs-agent.bat
call gs-agent.bat
The above LUS configuration will serve up to 50 partitions running on 100 GSCs.With larger environments increasing the heap size and GC tuning is required.
Running Multiple Groups
You may have a set of LUS/GSM managing GSCs associated to a specific group. Let’s assume you would like to “break” your network into 2 groups. Here is how you should start the GigaSpaces XAP runtime environment:
export LOOKUPGROUPS=GroupX
gs-agent.sh gsa.global.lus 0 gsa.lus 1 gsa.global.gsm 0 gsa.gsm 1 gsa.gsc 0
export LOOKUPGROUPS=GroupX
gs-agent.sh gsa.global.lus 0 gsa.lus 0 gsa.global.gsm 0 gsa.gsm 0 gsa.gsc 4
export LOOKUPGROUPS=GroupX
gs-agent.sh gsa.global.lus 0 gsa.lus 1 gsa.global.gsm 0 gsa.gsm 1 gsa.gsc 0
export LOOKUPGROUPS=GroupY
gs-agent.sh gsa.global.lus 0 gsa.lus 0 gsa.global.gsm 0 gsa.gsm 0 gsa.gsc 2
export LOOKUPGROUPS=GroupX
gs deploy-space -cluster schema=partitioned total_members=4 spaceX
export LOOKUPGROUPS=GroupY
gs deploy-space -cluster schema=partitioned total_members=2 spaceY
Running Multiple Locators
You may have a set of LUS/GSM managing GSCs associated to a specific locator. Let’s assume you would like to “break” your network into 2 groups using different lookup locators. Here is how you should start the GigaSpaces XAP runtime environment:
export LUS_JAVA_OPTIONS=-Dcom.sun.jini.reggie.initialUnicastDiscoveryPort=8888
export LOOKUPLOCATORS=127.0.0.1:8888
export EXT_JAVA_OPTIONS=-Dcom.gs.multicast.enabled=false
gs-agent.sh gsa.global.lus 0 gsa.lus 1 gsa.global.gsm 0 gsa.gsm 1 gsa.gsc 0
export LOOKUPLOCATORS=127.0.0.1:8888
export EXT_JAVA_OPTIONS=-Dcom.gs.multicast.enabled=false
gs-agent.sh gsa.global.lus 0 gsa.lus 0 gsa.global.gsm 0 gsa.gsm 0 gsa.gsc 4
export LUS_JAVA_OPTIONS=-Dcom.sun.jini.reggie.initialUnicastDiscoveryPort=9999
export LOOKUPLOCATORS=127.0.0.1:8888
export EXT_JAVA_OPTIONS=-Dcom.gs.multicast.enabled=false
gs-agent.sh gsa.global.lus 0 gsa.lus 1 gsa.global.gsm 0 gsa.gsm 1 gsa.gsc 0
export LOOKUPLOCATORS=127.0.0.1:9999
export EXT_JAVA_OPTIONS=-Dcom.gs.multicast.enabled=false
gs-agent.sh gsa.global.lus 0 gsa.lus 0 gsa.global.gsm 0 gsa.gsm 0 gsa.gsc 2
export LOOKUPLOCATORS=127.0.0.1:8888
gs deploy-space -cluster schema=partitioned total_members=4 spaceX
export LOOKUPLOCATORS=127.0.0.1:9999
gs deploy-space -cluster schema=partitioned total_members=2 spaceY
On top of the Lookup service, there is also an alternative way to export the space proxy - it is done via the RMI registry (JNDI). It is started by default within any JVM running a GSC/GSM. By default, the port used is 10098 and above. This option should be used only in special cases where somehow there is no way to use the default lookup service. Since this is the usual RMI registry, it suffers from known problems, such as being non-distributed, non-highly-available, etc.
The lookup service runs by default as a standalone JVM process started by the GSA. You can also embed it to run together with the GSM. In general, you should run 2 lookup services per system. Running more than 2 lookup services may cause an overhead, due to the chatting and heartbeat mechanism performed between the services and the lookup service, to signal the existence of the service.
Zones
The XAP Zone allows you to “label” a running GSC(s) before starting it. The XAP Zone should be used to isolate applications and a Data-Grid running on the same network. It has been designed to allow users to deploy a processing unit into specific set of GSCs where all these sharing the same set of LUSs and GSMs.
The Zone property can be used for example to deploy your Data-Grid into a specific GSC(s) labeled with specific zone(s). The zone is specified prior to the GSC startup, and cannot be changed once the GSC has been started.
You should make sure you have an adequate number of GSCs running, prior to deploying an application whose SLA specified a specific zone.
To use Zones when deploying your PU you should:
export EXT_JAVA_OPTIONS=-Dcom.gs.zones=webZone ${EXT_JAVA_OPTIONS}
gs-agent gsa.gsc 2
gs deploy -zones webZone myWar.war
Running Multiple Zones
You may have a set of LUS/GSM managing multiple zones (recommended) or have a separate LUS/GSM set per zone. In such a case (set of LUS/GSM managing multiple zones) you should run these in the following manner:
gs-agent.sh gsa.global.lus 0 gsa.lus 1 gsa.global.gsm 0 gsa.gsm 1 gsa.gsc 0
export EXT_JAVA_OPTIONS=-Dcom.gs.zones=zoneX ${EXT_JAVA_OPTIONS}
gs-agent.sh gsa.global.lus 0 gsa.lus 0 gsa.global.gsm 0 gsa.gsm 0 gsa.gsc 4
export EXT_JAVA_OPTIONS=-Dcom.gs.zones=zoneY ${EXT_JAVA_OPTIONS}
gs-agent.sh gsa.global.lus 0 gsa.lus 0 gsa.global.gsm 0 gsa.gsm 0 gsa.gsc 2
Note that with XAP 7.1.1 new variables provided that allows you to set different JVM arguments for GSC,GSM,LUS,GSA separately (GSA_JAVA_OPTIONS , GSC_JAVA_OPTIONS , GSM_JAVA_OPTIONS , LUS_JAVA_OPTIONS).
Failover Considerations
GigaSpaces XAP provides continuous high-availability even when the infrastructure processes or entire (physical/virtual) machines fail. This capability is provided out of the box but does require some attention to configuration to meet the needs of your specific application.
N + 1 and N + 2 Configurations
Determining the optimal high availability configuration for your particular application requires balancing the cost of additional hardware (or virtual machines) against the risk of downtime. In most cases it pays off having additional resources available to avoid downtime, compromising system health, instability, poor reliability , no durability and incompleteness.
The two most common GigaSpaces XAP deployment configurations are referred to as N + 1 and N + 2. This refers to the number of machines running XAP that can fail without compromising the data grid and its applications to deliver reasonable performance and to stay in good health. In an N + 1 configuration, the core N machines have sufficient RAM and CPU power to run the application if one of the N + 1 machines fail. In an N + 2 configuration, the same is true if two of the machines fail or become unavailable.
In either configuration, the data grid (or any deployed business logic) is distributed across all available machines. Each machine hosts a set of GSCs and there are at least two GSMs and two LUSs running. When deploying regular (static) PU, you may have spare GSCs available on each machine to accommodate a failure. If a machine becomes unavailable, the backup PU instance corresponding to the primary nodes on that machine become primaries and the GSM provision a new backup in one of the spare GSCs. In this case you may need to call the rebalance utility to distribute primary and backups evenly across all GSCs. This failover is transparent to clients of the application and business logic running within it. When deploying elastic PU, GSCs will be created on the fly , where missing PU instances will be provisioned into these newly started GSCs. In this case primary and backup instances will be automatically distributed evenly across all machines.
Grid Failure Handling Strategy
When deploying your XAP based system in production you should consider the following failure scenarios. These should address, GSC , Machine/VM and a complete Data-Center failure:
- Single GSC Failure - This is the simplest case - good for small deployment that are not mission critical and does not require continuous high-availability to survive multiple failures. The GSA will manage the GSC life-cycle locally or globally and accomadate GSC failure. This assumes you are using static PU deployment.
- Multiple GSCs Failures - In this case you should deploy using the Elastic PU. This will start GSCs as needed on available VM/Machines to survive multiple failures and support dynamic scaling.
- Complete VM/ Machine Failure - Elastic PU deployment should be used together with XAP init.d setup. This will start the GigaSpaces XAP agent once the VM/Machine is restarted. Cloudify can be used to complete orchestration of the XAP installation and configuration.
- Complete Data-Center Failure - Elastic PU together with XAP init.d setup should be used; Data replication over the WAN using the WAN Gateway should be used. Cloudify can be used to complete orchestration of the XAP installation and configuration.
Guaranteed Notifications
When using notifications (notify container, session messaging API) you should enable Guaranteed Notifications to address a primary space failure while sending notifications. This allows the backup once promoted into a primary, to continue the notification delivery. The Guaranteed Notifications managed on the client side.
When considering a notify container that is embedded with the space, please note the guaranteed notifications are not supported in this scenario - This means that upon failure notifications that has been send might not be fully processed. In this case blocking read/asyc read should be considered as an alternative to notifications.
Balanced Primary-Backups Provisioning
When having a failure of the data grid nodes or a machine running XAP you should consider having even distribution of the primary and backups instances across all existing machines running XAP. This ensure balanced CPU utilization across all XAP machines. The Elastic processing unit should be used to deploy the data grid - it support even primary/backup distribution automatically when XAP machine fails and when a new one added to the grid. In this case spare GSCs on each XAP machine are not required.
CPU Utilization
CPU utilization should not exceed the 40 % in average to support complete machine/VM failure. This headroom will enable the machines running XAP to cope with the additional capacity required when one or more machines running the grid will fail or go through maintenance.
LUS Failure
To support LUS (lookup service) failure at least two LUS should be started. You may run in Global or local LUS configuration that ensures two LUS will be running. Running Global LUS configuration (recommended when using multicast lookup discovery configuration) ensure you will have two LUS running on two different machines even if a machine running a LUS fails. When using unicast lookup discovery configuration and a LUS failed the clients and service grid components may throw exceptions as internally they will be trying to perform lookup discovery frequently for the missing lookup. You may configure the lookup discovery intervals using the com.gigaspaces.unicast.interval property.
GSA Failure
The GSA acting as a process manager, watching the GSC , LUS , ESM and GSM processes. Having the GSA failed is a very rare scenario. If it happens you should look for unusual HW , OS or JDK failure that may cause it. To address GSA failure you should run it as a service. This how the OS will restart it automatically once failed. See how you can run it as a Windows Service or a Linux Service.
GSM Failure
The GSM responsible for deployment and provisioning of deployed PUs(stateless , statefull). It is utilized at the deploy time, PU failure and PU migration from one GSC to another GSC. To support HA you should have two GSMs started per grid. You may Global or local GSM configuration that ensures two GSM will be running. In most cases Global GSM configuration is recommended unless you require hot deploy functionality.
ESM Failure
The ESM responsible for elastic PU provisioning when deployed and addressing space instances rebalance once PU should scale up/down/in/out or when GSA failed or started. When ESM fails it will be restarted automatically using one of the existing agents.
XAP Distributed Transactions
XAP Distributed Transactions involves XAP remote or local Distributed Transaction Manager and one or more data grid. With a remote Distributed Transaction Manager you should consider running at least two remote transaction managers. It is recommended to use a local Distributed Transaction Manager as it makes the overall architecture simpler.
XA Transactions
XA Transactions involves the XA transaction manager, XAP data grid node(s) and some additional participant(s). The transaction manager usually deployed independently. The transaction manager might fail, so it should be deployed in some HA configuration. Client code should support transaction manager failure by caching relevant transaction exception, and retry the activity by aborting the old transaction, starting a new transaction , executing relevant operations and committing. The recommended transaction manager XAP certified with is Atomikos and JBoss.
Mirror Service Failure
The Mirror Service like the WAN Gateway acting as a broker, responsible to persist activities conducted at the data grid into external data source such as a database.
The Mirror Service does not hold state so its failure would not result any data lose, but its failure means data will not be stored into the external data source. You do not need to deploy the mirror in a clustered configuration (aka primary-backup). By default XAP will try to start the mirror service in case it failed. Since in many cases the Mirror service accessing a database, you might have the database accepting connection only from specific machine with specific ports. To address this, you should configure the database to allow connections from all machines that may run the mirror service - by default all machines running XAP.
WAN Gateway Failure
The WAN gateway like the mirror service acting as a broker, responsible to replicate activities conducted at the local data grid into another (remote) data grid. The WAN Gateway does not hold state so its failure would not result any data lose, but its failure means data will not be replicated between source and destination data grid. You do not need to deploy the WAN Gateway in a clustered configuration (aka primary-backup). By default XAP will try to start a WAN Gateway in case it failed. Since WAN Gateway usually configured to use specific port on specific machine(s), you should configure the WAN Gateway PU to be provisioned into specific machine(s).
Capacity Planning
In order to estimate the amount of total RAM and CPU required for your application, you should take the following into consideration:
- The Object Footprint within the space.
- Active Clients vs. Cores vs. Heap Size.
- The number of space partitions and backups.
The Capacity Planning section provides a detailed explanation how to estimate the resources required.
PU Packaging and CLASSPATH
User PU Application Libraries
A Processing Unit JAR file, or a Web Application WAR file should include within its lib folder, all the necessary JARs required for the application. Resource files should be placed within one of the JAR files within the PU JAR, located under the lib folder. In addition, the PU JAR should include the pu.xml within the META-INF\spring folder.
In order to close LRMI threads when closing application,please use:LRMIManager.shutdown().
Data-Grid PU Libraries
When deploying a Data-Grid PU, it is recommended that you include all space classes and their dependency classes as part a PU JAR file. This PU JAR file should include a pu.xml within the META-INF\spring, to include the space declarations and relevant tuning parameters.
GS-UI Libraries
It is recommended that you include all space classes and their dependency classes as part of the GS-UI CLASSAPTH . This makes sure that you can query the data via the GS-UI. To set the GS-UI classpath, set the POST_CLASSPATH variable prior to calling the GS-UI script to have the application JARs locations.
To avoid the need to load the same library into each PU instance classloader running within the GSC, you should place common libraries (such as JDBC driver, logging libraries, Hibernate libraries and their dependencies) at the <gigaspaces-xap root>\lib\optional\pu-common folder. You may specify the location of this folder using the com.gs.pu-common system property.
JVM Tuning
In most cases, the applications using XAP are leveraging machines with very fast CPUs, where the amount of temporary objects created is relatively large for the JVM garbage collector to handle with its default settings. This means careful tuning of the JVM is very important to ensure stable and flawless behavior of the application.
Below represents the different XAP processes a virtual or a physical machine may run:
- GSA - Very lightweight process in terms of its memory and CPU usage. This process does not require any tuning. You should have one per machine or in some cases one per Zone.
- GSC - The runtime environment. This is where the data grid and the deployed processing units are running. This process requires the relevant tuning to address the memory capacity required. Number of GSCs should not exceed:
Total # of cores / 4. With virtual machine setup you should have one GSC per VM. - GSM - Lightweight process. Does not require any tuning unless you have very large cluster (over 100 nodes). You should have two of these per XAP grid.
- LUS - Lightweight process. Does not require any tuning unless you have very large cluster (over 100 nodes). You should have two of these per XAP grid.
- ESM - Lightweight process. Does not require any tuning unless you have very large cluster (over 100 nodes). You should have one of this per XAP grid.
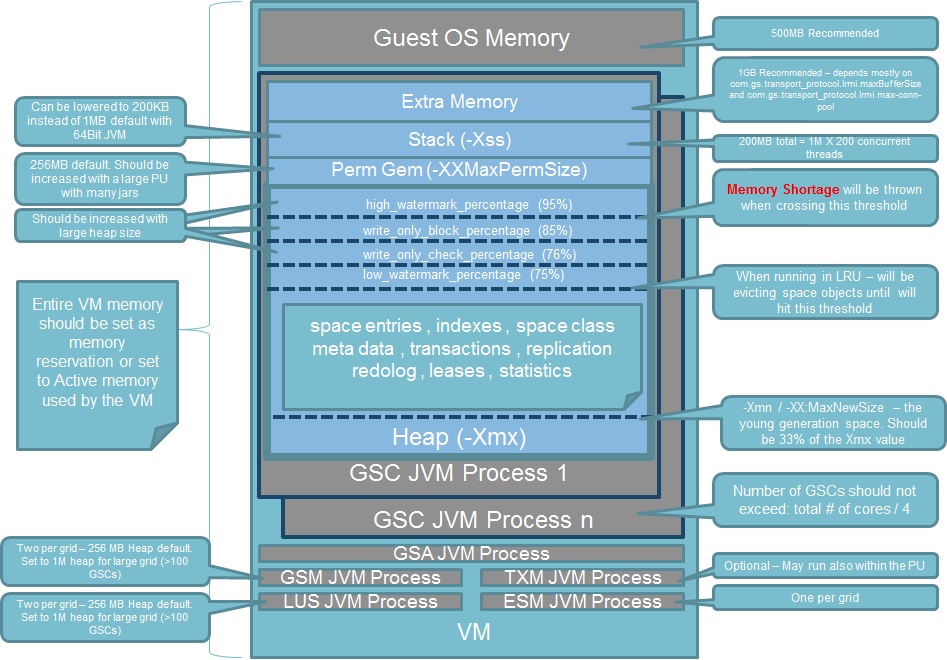
XAP VM Memory size =
Guest OS Memory + JVM Memory for all GSCs + JVM Memory for GSM + JVM Memory for LUS + JVM Memory for ESM
JVM Memory for a GSC =
JVM Max Heap (-Xmx value) + JVM Perm Size (-XX:MaxPermSize) + NumberOfConcurrentThreads * (-Xss) + "extra memory"
Space Object Footprint
In many cases you may need to calculate the Space Object Footprint. The object footprint within the IMDG is determined, based on:
- The original object size - the number of object fields and their content size.
- The JVM type (32 or 64 bit) - a 64 bit JVM might consume more memory due to the pointer address size.
- The number of indexed fields - every indexed value means another copy of the value within the index list.
- The number of different indexed values - more different values (uniform distribution) means a different index list per value.
- The object UID size - the UID is a string-based field, and consumes about 35 characters. You might have the object UID based on your own unique ID.
The actual footprint depends on the amount of indexed fields and the data distribution. Each index consumes:
120 Bytes + index value size + (number of object instances with this indexed value X 16)
Footprint Test
The best way to determine the exact footprint is via a simple test that allows you to perform some extrapolation when running the application in production. Here is how you should calculate the footprint:
Step 1. Start a single IMDG instance.
Step 2. Take a measurement of the free memory (use JConsole or jmap).
Step 3. Write a sample number of objects into the IMDG (have a decent number of objects written - 100,000 is a good number).
Step 4. Measure the free memory again.
This test should give good understanding of the object footprint within the IMDG. Don’t forget that if you have a backup instance running, the amount of memory you will need to accommodate for your objects, is double.
Compound Index reduce Index Footprint
A Compound Index used with AND queries to speed up the Query execution time. It combines multiple fields into a single index. Using A Compound Index may avoid multiple indexes on multiple fields that may reduce Index footprint.
UseCompressedOops JVM Option
The -XX:+UseCompressedOops allows 64 bit JVM heap up to 32GB to use 32 bit reference address. It may reduce overall footprint in 20-40%.
Compressed Storage Mode
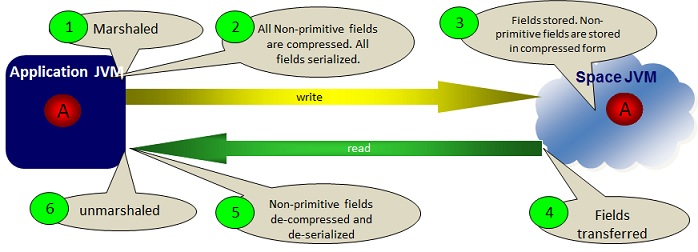
The Compressed Storage mode may be used to reduce non-primitive fields footprint when stored within the space. This option is not available for .NET. This option compress the data on the client , where data stays compressed in the space and de-compress it when reading it back on the client side. It may impact performance.
Customized Initial Load
The default Space Data source Initial Load behavior loads all space classes data into each partition and later filter out irrelevant objects. This activity may introduce large amount of garbage to be collected. Using SQL MOD query to fetch only the relevant data items to be loaded into each partition would speed up the initial load time and drastically reduce the amount of garbage generated during this process.
Redo Log Sizing
The amount of redo log data depends on :
- Amount of in flight activity
- Backup performance
- Primary backup connectivity - long disconnection means plenty of redo log in memory.
Since redo log swap in some point to the disk, have its location on SSD drive. Do not use HDD to store redolog data. Redo log footprint similar to actual raw data footprint without indexes.
JVM Basic Settings
See below examples of JVM settings recommended for applications that might generate large number of temporary objects. In such situations you afford long pauses due to garbage collection activity.
These settings are good for cases where you are running a IMDG or when the business logic and the IMDG are collocated. For example IMDG with collocated Polling /Notify containers, Task executors or Service remoting:
JDK 1.6
For JDK 1.6 - CMS mode - good for low latency scenarios:
-server -Xms8g -Xmx8g -Xmn2g -XX:+UseConcMarkSweepGC -XX:+UseParNewGC
-XX:CMSInitiatingOccupancyFraction=60 -XX:+UseCMSInitiatingOccupancyOnly
-XX:MaxPermSize=256m -XX:+ExplicitGCInvokesConcurrent -XX:+UseCompressedOops
-XX:+CMSClassUnloadingEnabled -XX:+CMSParallelRemarkEnabled
JDK 1.7 - 1.8
For JDK 1.7 - 1.8 - g1 mode - good for low latency scenarios:
-server -Xms8g -Xmx8g -XX:+UseG1GC -XX:MaxGCPauseMillis=500 -XX:InitiatingHeapOccupancyPercent=50 -XX:+UseCompressedOops
Advanced options for JDK 1.7 with suggested values provided:
-XX:MaxTenuringThreshold=25 -XX:ParallelGCThreads=8 -XX:ConcGCThreads=8 -XX:G1ReservePercent=10 -XX:G1HeapRegionSize=32m
In case your JVM is throwing an ‘OutOfMemoryException’, the JVM process should be restarted. You need to add this property to your JVM setting: SUN -XX:+HeapDumpOnOutOfMemoryError -XX:OnOutOfMemoryError=“kill -9 %p” JROCKIT -XXexitOnOutOfMemory
Young generation Size (Xmn)
This setting controls the size of the heap allocated for the young generation objects it represents all the objects which have a short lifetime. Young generation objects are in a specific location into the heap, where the garbage collector will pass often. All new objects are created into the young generation region (called “eden”). When an object survive is still “alive” after more than 2-3 gc cleaning, then it will be swap has an “old generation” : they are “survivor”. A recommended value for the Xmn should be 33% of the Xmx value.
Thread Stack Tuning (Xss)
The threads stack size many times should be tuned. Its default size may be too high. In Java SE 6, the default on Sparc is 512k in the 32-bit VM, and 1024k in the 64-bit VM. On x86 Solaris/Linux it is 320k in the 32-bit VM and 1024k in the 64-bit VM.
On Windows, the default thread stack size is read from the binary (java.exe). As of Java SE 6, this value is 320k in the 32-bit VM and 1024k in the 64-bit VM.
You can reduce your stack size by running with the -Xss option. For example:
java -server -Xss384k
On some versions of Windows, the OS may round up thread stack sizes using very coarse granularity. If the requested size is less than the default size by 1K or more, the stack size is rounded up to the default; otherwise, the stack size is rounded up to a multiple of 1 MB. 64k is the least amount of stack space allowed per thread.
Extra Memory
This is memory required for NIO direct memory buffers, JIT code cache, classloaders, Socket Buffers (receive/send), JNI, GC internal info. Direct memory buffers usage for Socket Buffers utilization on the GSC side :
com.gs.transport_protocol.lrmi.maxBufferSize X com.gs.transport_protocol.lrmi.max-threads
For example - with default maxBufferSize size and 100 threads :
64k X 100 = 6400KB = 6.4MB
With large objects and batch operations (readMultiple , writeMultiple , Space Iterator) increasing the maxBufferSize may improve the performance.
MaxDirectMemorySize
This JVM option specifies the maximum total size of java.nio (New I/O package) direct buffer allocations. It is used with network data transfer and serialization activity.
The default value for direct memory buffers depends on your version of your JVM. Oracle HotSpot has a default equal to maximum heap size (-Xmx value), although some early versions may default to a particular value. To control this specific memory area use the -XX:MaxDirectMemorySize. See example below:
java -XX:MaxDirectMemorySize=2g myApp
Format:
-XX:MaxDirectMemorySize=size[g|G|m|M|k|K]`
Some useful references:
- Getting Started with the G1 Garbage Collector
- jdk7 garbage collection and documentation
- g1 cms java garbage collector
- java7 g1 options
- large java heap with g1 collector part 1
It is highly recommended that you use the latest JDK release when using these options.
Capture Detailed Garbage Collection stats
To capture the detailed information about garbage collection and how it is performing, add following parameters to JVM settings:
-verbose:gc -XX:+PrintGCDetails -XX:+PrintGCTimeStamps -Xloggc:/path/to/log/directory/gc-log-file.log
Modify the path and file names appropriately. You will need to use a different file name for each invocation in order to not overwrite the files from multiple processes.
Soft References LRU Policy
In the attempt to provide the highest level of performance possible, XAP takes advantage of features in the Java language that allows for effective caching in the face of memory demands. In particular, the SoftReference class is used to store data up until there is a need for explicit garbage collection, at which point the data stored in soft references will be collected if possible. The system default is 1000, which represents the amount of time (in milliseconds) they will survive past their last reference. -XX:SoftRefLRUPolicyMSPerMB is the parameter that allows you to determine how much data is cached by allowing the JVM to control how long it endures; A recommended setting this value to 500 in active, dynamic systems:
-XX:SoftRefLRUPolicyMSPerMB=500
The above means that softly reachable objects will remain alive for 500 milliseconds after the last time they were referenced.
Permanent Generation Space
For applications that are using relatively large amount of third party libraries (PU using large amount of jars) the default permanent generation space size may not be adequate. In such a case, you should increase the permanent generation space size and please also refer to the suggested parameters above that should be used together with the other CMS parameters (-XX:+CMSClassUnloadingEnabled). Here are a suggested values:
-XX:PermSize=512m -XX:MaxPermSize=512m
GigaSpaces XAP is a Java-based product. .NET and C++ applications using XAP should also be aware the usage of the JVM libraries as part of the .NET and C++ client libraries.
See the Tuning Java Virtual Machines section and the Java SE 6 HotSpot Virtual Machine Garbage Collection Tuning for detailed JVM tuning recommendations.
Space Memory Management
The Space supports two Memory Management modes:
ALL_IN_CACHE- this assumes all application data is stored within the space.LRU- this assumes some of the application data is stored within the space, and all the rest is stored in some external data source.
When running with ALL_IN_CACHE, the memory management:
- Stops clients from writing data into the space once the JVM utilized memory crosses the WRITE threshold (percentage of the heap max size).
- Throws a
MemoryShortageExecptionback to the client once the JVM utilized memory crosses thehigh_watermark_percentagethreshold.
When running with ALL_IN_CACHE, you should make sure the default memory management parameters are tuned according the JVM heap size. A large heap size (over 2 G RAM) requires special attention. Here is an example of memory manager settings for a 10 G heap size:
<os-core:embedded-space id="space" name="mySpace" >
    <os-core:properties>
        <props>
            <prop key="space-config.engine.memory_usage.high_watermark_percentage">95</prop>
            <prop key="space-config.engine.memory_usage.write_only_block_percentage">94</prop>
            <prop key="space-config.engine.memory_usage.write_only_check_percentage">93</prop>
            <prop key="space-config.engine.memory_usage.low_watermark_percentage">92</prop>
        </props>
    </os-core:properties>
</os-core:embedded-space>
Local Cache
The local cache is used as a client side cache that stores objects the client application reads from the space. It speeds up repeated read operations of the same object. The readById/readByIds operation has a special optimization with a local cache that speeds up the retrieval time of the object from the local cache, in the case that it is already cached. The local cache evicts objects once a threshold is met. When there is a client application with a large heap size, you might want to configure the local cache eviction parameters to control the eviction behavior:
<os-core:space-proxy id="space" name="mySpace" />

<os-core:local-cache id="localCacheSpace" space="space" update-mode="PULL" >
    <os-core:properties>
        <props>
            <prop key="space-config.engine.cache_size">5000000</prop>
            <prop key="space-config.engine.memory_usage.high_watermark_percentage">75</prop>
            <prop key="space-config.engine.memory_usage.write_only_block_percentage">73</prop>
            <prop key="space-config.engine.memory_usage.write_only_check_percentage">71</prop>
            <prop key="space-config.engine.memory_usage.low_watermark_percentage">45</prop>
            <prop key=" space-config.engine.memory_usage.eviction_batch_size">1000</prop>
            <prop key="space-config.engine.memory_usage.retry_yield_time">100</prop>
            <prop key="space-config.engine.memory_usage.retry_count">20</prop>
        </props>
    </os-core:properties>
</os-core:local-cache>
<os-core:giga-space id="gigaSpace" space="localCacheSpace"/>
- With the above parameters, the local cache is evicted once the client JVM memory utilization crosses the 75% threshold (or there are more than 5,000,000 objects within the local cache).
- Data is evicted in batches of 1,000 objects, trying to lower the memory utilization to 45%.
- If the eviction mechanism does not manage to lower the utilization to 45%, it has another 20 tries and stops.
- After each eviction activity, and before measuring the memory utilization, a pause of 100 ms happens, to allow the JVM to release the evicted objects.
The space-config.engine.cache_size is set to a large value, to instruct the local cache to evict, based on the available free memory, and not based on the total number of objects within the local cache.
Primaries Space Distribution
By default, when running GSCs on multiple machines and deploying a space with backups, XAP tries to provision primary spaces to all available GSCs across all the machines.
The max-instances-per-vm and the max-instances-per-machine deploy parameters should be set when deploying your Data-Grid, to determine how the deployed Processing Unit (e.g. space) is provisioned into the different running GSCs.
Without setting the max-instances-per-vm and the max-instances-per-machine, XAP might provision a primary and a backup instance of the same partition into GSCs running on the same physical machine. To avoid this behavior, you should set the max-instances-per-vm=1 and the max-instances-per-machine=1. This makes sure that the primary and backup instances of the same partition are provisioned into different GSCs running on different machines. If there is one machine running GSCs and max-instances-per-machine=1, backup instances are not provisioned.
Here is an example of how you should deploy a Data-Grid with 4 partitions, with a backup per partition (total of 8 spaces), where you have 2 spaces per GSC, and the primary and backup are not running on the same box (even when you have other GSCs running):
gs deploy-space -cluster schema=partitioned-sync2backup total_members=4,1
   -max-instances-per-vm 2  -max-instances-per-machine 1 MySpace
After a machine startup (where GSCs are started), when the ESM is not used to deploy the IMDG, spaces do not “re balance” across all the machines to have an even number of primaries per machine. You may have machines running more (or all) primaries, and another machine running only backups.
Total Max Instances Per VM
This parameter controls the total amount of PU instances that can be instantiated within a GSC. This is very different than the max-instances-per-vm that controls how many instances a partition may have within a GSC. To control the Total Max PU Instances a GSC may host you should use com.gigaspaces.grid.gsc.serviceLimit system property and set its value before starting the GigaSpaces agent:
set GSC_JAVA_OPTIONS=-Dcom.gigaspaces.grid.gsc.serviceLimit=1
Note the default value of the com.gigaspaces.grid.gsc.serviceLimit is 500 that may not work well for most production environments.
With most production environments with static deployment configuration it is advised to keep the com.gigaspaces.grid.gsc.serviceLimit value to ONE. Having multiple space instances within the same GSC makes it hard to handle failures, handle garbage collection and resource configuration such as LRMI thread pool , etc.
By using com.gigaspaces.grid.gsc.serviceLimit=1 you may avoid a scenario where a new space or failed space instance would be provisioned into a GSC that already hosting a space instance. This may result Memory Shortage Exception or Out of Memory Error that may cause a provisioning failure.
Rebalancing - Dynamic Data Redistribution
Automatic Rebalancing
XAP supports automatic discovery, rebalancing (aka Dynamic Redistribution of Data) and expansion/contraction of the IMDG while the application is running. When deploying an IMDG, the system partitions the data (and the collocated business logic) into logical partitions. You may choose the number of logical partitions or let XAP calculate this number.
The logical partitions may initially run on certain containers, and later get relocated to other containers (started after the data grid has been deployed) on other machines, thus allowing the system to expand and increase its memory and CPU capacity while the application is still running. The number of logical partitions and replicas per partition should be determined at deployment time. The number of containers hosting the IMDG instances may be changed at runtime.
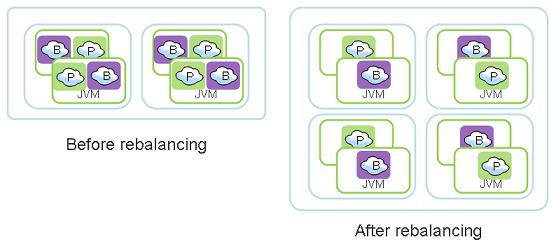
The component that is responsible to scale the IMDG at runtime is called the Elastic Service Manager (ESM) and it is used with the Elastic Processing Unit:
When using the Elastic Processing Unit, instances will be continuously re balanced across all available machines.
Storage Type - Controlling Serialization
When a client application accessing a remote space (using a clustered topology or non-clustered) the data is serialized and sent over the network to the relevant JVM hosting the target space partition. The serialization involves some overhead. The Storage Type decoration allows you to control the serialization behavior when non-primitive fields used with your space class.
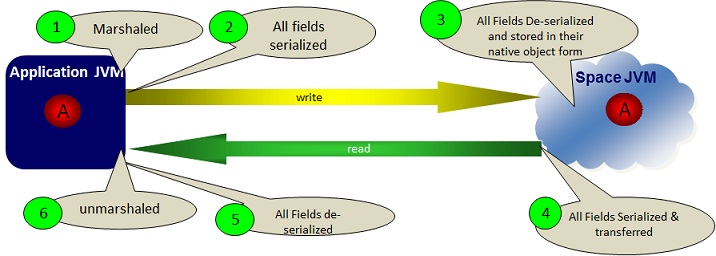
OBJECT Storage Type
The OBJECT (default) serialization mode (called also native) performs serialization of all non-primitive fields at the client side, and then de-serialize these at the space side before stored within the space.
This mode is optimized for scenarios when there is a business logic colocated with the space (e.g. notify/polling container) or when having business logic that is sent to be executed within the space (e.g. Task Executor). The colocated business logic access non-primitive space object fields without going through any serialization. This speeds up any activity performed by the colocated business logic. The downside with this mode, is the relative overhead associated with the remote client due-to the serialization/de-serialization involved with non-primitive space object fields.
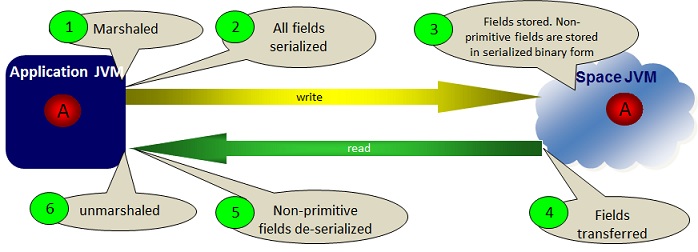
BINARY Storage Type
When having space objects that embed large collections (e.g. List, Map data types) where there is no colocated business logic running with the space (e.g. polling/notify container colocated with the space), you should use the BINARY Storage Type.
When running with this mode, the collections within the space object are serialized at the client side but are not de-serialized at the space side before stored within the space; these are stored in their binary form. When reading the space object back into the client side, these collections are sent back into the client application without going through any serialization at the space side (as they are already stored in their binary serialized form), and de-serialized at the client side. Due-to this optimization, this mode speeds up write and read performance when the space object involves collections with relatively large amount of elements.
You may control the Storage type at the space level, class level or field level.
See the Controlling Serialization for more details.
Runtime File Location
GigaSpaces XAP generates some files while the system is running. You should change the location of the generated files location using the following system properties. See below how:
| System Property | Description | Default |
|---|---|---|
| com.gigaspaces.logger.RollingFileHandler.filename-pattern | The location of log files and their file pattern. | <gigaspaces-xap root>\logs |
| com.gs.deploy | The location of the deploy directory of the GSM. | <gigaspaces-xap root>\deploy |
| com.gs.work | The location of the work directory of the GSM and GSC. Due to the fact that this directory is critical to the system proper function, it should be set to a local storage in order to avoid failure in case of network failure when a remote storage is used. | <gigaspaces-xap root>\work |
| user.home | The location of system defaults config. Used by the GS-UI, and runtime system components. | |
| com.gigaspaces.lib.platform.ext | PUs shared classloader libraries folder. PU jars located within this folder loaded once into the JVM system classloader and shared between all the PU instances classloaders within the GSC. In most cases this is a better option than the com.gs.pu-common for JDBC drivers and other 3rd party libraries. This is useful option when you want multiple processing units to share the same 3rd party jar files and do not want to repackage the processing unit jar whenever one of these 3rd party jars changes. |
<gigaspaces-xap root>\lib\platform\ext |
| com.gs.pu-common | The location of common classes used across multiple processing units. The libraries located within this folder loaded into each PU instance classloader (and not into the system classloader as with the com.gigaspaces.lib.platform.ext. |
<gigaspaces-xap root>\lib\optional\pu-common |
| com.gigaspaces.grid.gsa.config-directory | The location of the GSA configuration files. The GigaSpaces Agent (GSA) manages different process types. Each process type is defined within this folder in an xml file that identifies the process type by its name. | <gigaspaces-xap root>\config\gsa |
| java.util.logging.config.file | It indicates file path to the Java logging file location. Use it to enable finest logging troubleshooting of various GigaSpaces XAP Services. You may control this setting via the GS_LOGGING_CONFIG_FILE_PROP environment variable. |
<gigaspaces-xap root>\config\gs_logging.properties |
The com.gigaspaces.lib.platform.ext and the com.gs.pu-common are useful to decrease the deployment time in case your processing unit contains a lot of 3rd party jars files. In such case, each GSC will download the processing unit jar file (along with all the jars it depends on) to its local working directory from the GSM, and in case of large deployments spanning tens or hundreds of GSCs this can be quite time consuming. In such cases you should consider placing the jars on which your processing unit depends on in a shared location on your network, and then point the com.gs.pu-common or com.gigaspaces.lib.platform.ext directory to this location.
Log Files
XAP generates log files for each running component . This includes GSA, GSC, GSM, Lookup service and client side. By default, these are created within the <gigaspaces-xap-root>\logs folder. After some time you might end up with a large number of files that are hard to maintain and search. You should backup old log files or delete these. You can use the logging backup-policy to manage your log files.
Hardware Selection
The general rule when selecting the HW to run GigaSpaces XAP would be: The faster the better. Multi-core machines with large amount of memory would be most cost effective since these will allow GigaSpaces XAP to provide ultimate performance leveraging large JVM heap size handling simultaneous requests with minimal thread context switch overhead.
Running production systems with 30G-50G heap size is doable with some JVM tuning when leveraging multi-core machines. The recommended HW is Intel Xeon Processor 5600 Series. Here is an example for recommended server configuration:
| Model | Cisco UCS B200 M2 Blade Server | Cisco UCS B250 M2 Extended Memory Blade Server |
|---|---|---|
| Processor Sockets | 2 | 2 |
| Processors Supported | Intel Xeon processor 5600 Series | Intel Xeon processor 5600 Series |
| Memory Capacity | 12 DIMMs; up to 192 GB | 48 DIMMs; up to 384 GB |
| Memory Size and Speed | 4, 8, and 16 GB DDR3; 1066 MHz and 1333 MHz | 4 and 8 GB DDR3; 1066 MHz and 1333 MHz |
| Internal Disk Drive | 2x 2.5-in. SFF SAS or 15mm SATA SSD | 2x 2.5-in. SFF SAS or 15mm SATA SSD |
| Integrated Raid | 0,1 | 0,1 |
| Mezzanine I/O Adapter Slots | 1 | 2 |
| I/O Throughput | Up to 20 Gbps | Up to 40 Gbps |
| Form Factor | Half width | Full width |
| Max. Servers per Chassis | 8 | 4 |
CPU
Since most of the application activities are conducted in-memory, the CPU speed impacts your application performance fairly drastically. You might have a machine with plenty of CPU cores, but a slow CPU clock speed, which eventually slows down the application or the Data-Grid response time. So as a basic rule, pick the fastest CPU you can find. Since the Data-Grid itself and its container are highly multi-threaded components, it is important to use machines with more than a single core to host the GSC to run your Data-Grid or application. A good number for the amount of GSCs per machine is half of the total number of cores.
Disk
With any XAP based system log files will be generated. A good best practice would be to allocate at least 100MB of free disk size per machine running XAP. Make sure you delete old log files or move them to some backup location. XAP Data-Grid may overflow data into the work directory when there is a long replication disconnection or replication delay. The location of the work directory should be on a local storage on each XAP node in order to make this replication backlog data always available to the node. The storage should have enough disk space to store the replication backlog as explained in Controlling the Replication Redo Log page.
Virtualized OS
GigaSpaces XAP supports VMWare vSphere 5+ running the following guest operating systems:
- Windows 2008 Server SP2
- Linux RHEL 5.x/6.x
- Solaris 10
Configuration:
- Only Type 1 Hypervisor is recommended for production use.
- vCPU may be over-subscribed, if it is under-utilized (less than 50%). In environments with high CPU utilization, vCPU must be reserved (pinned).
- Hyper-threading should be enabled.
- vMEM must be reserved (pinned).
Other considerations:
- Do not over-commit virtual memory
- Reserve memory at the virtual machine level
- When using replication, use anti-affinity rules to ensure that primary and backup nodes do not share the same virtual and machine physical host.
- Reserve sufficient memory for the operating system (~2GB per VM)
VM Tuning Guidelines
To determine the VM memory configuration, lets assume you are using Linux/Windows OS 64 Bit with no other significant process running on it (only XAP), where 2 XAP GSCs consume 60GB (30GB each), LUS and GSM consume 0.5GB each and the guest OS consumes 2GB. The total configured memory for the virtual machine would be:
VM memory for XAP VM = (2 X 30GB) + (2 X 0.5GB) + 2GB = 63GB
Set the VM memory as the memory reservation. You can choose to set the memory reservation as 63GB , but over time you should monitor the active memory used by the virtual machine that hosts XAP processes and adjust the memory reservation to the actual active memory value, which could be less than 63GB. NUMA rules apply - make sure that each socket on the server has at least 64GB of RAM to host this virtual machine, along with relevant number of vCPUs needed.
Plan for some Headroom
If your application data consume 10GB per GSC , allow for 50% headroom for optimal performance. This implies the actual heap utilization for the GSC should not cross the 15GB. Set the memory reservation to 17GB. Setting a memory reservation enforce a reserved physical memory to be available by VMware ESX® or ESXi to the virtual machine when it starts. Do not over commit memory. When sizing memory for XAP processes (GSC , GSA , GSM, LUS) on one virtual machine, the total reserved memory for the virtual machine should not exceed what is available within one NUMA node for optimal performance.
XAP GSC JVM and VM Ratio
Have one XAP GSC JVM instance per virtual machine. Typically, this is not a requirement. However, because XAP GSC JVMs can be quite large (up to 100-200GB), it is advisable to adhere to this rule in this case.
Increasing the JVM heap space to accommodate large data grid partition instance capacity is better than running a second instance of on the same single virtual machine. If increasing the JVM heap size is not an option, then consider placing the second GSC JVM on a separate newly created virtual machine, thus promoting more effective horizontal scalability. As you increase the number of XAP GSC, also increase the number of virtual machines to maintain a 1:1 ratio among the XAP GSC JVM and the virtual machines.
You should have minimum of four vCPU virtual machine running with a VM running a single XAP GSC. This should provide enough CPU power to handle both JVM garbage collection activity and application related JVM activity. For extreme low latency and highly concurrent applications accessing the data grid with multiple threads/clients you may need more than four vCPUs per virtual machine.
VM Placement
You may deploy a data-grid to provision multiple copies of the same data on any virtual machine. It is possible to accidentally place two redundant data copies on the same ESX/ESXi host. This is not optimal if a host fails. To create a more robust configuration, use VM1-to-VM2 anti-affinity rules to indicate to vSphere that VM1 and VM2 can never be placed on the same host because they hold replicated instances. You may use XAP Zones to control each replicated data-grid instances location to provision these on specific GSCs/VMs.
vMotion, DRS Cluster with XAP
Once you install XAP, place Vmware Distributed Resource Scheduler (DRS) in manual mode to prevent an automatic VMware vSphere® vMotion® migration that can impact XAP response times. vMotion can complement XAP features during scheduled maintenance to help minimize downtime impact due-to hardware and software upgrades. To speed up vMotion migration process it is recommended to trigger vMotion migrations over a 10GbE network interface.
Avoid vMotion operations with a VM running the lookup service (LUS) as the latency introduced to this process can cause members of XAP cluster to falsely suspect that other members are unavailable.
Avoid having vMotion moving multiple VMs in the same time. This might result a split brain and system instability.
Use DRS clusters dedicated to XAP. If this is not an option and XAP has to run in a shared DRS cluster make sure that DRS rules are set up to prevent vMotion migrating XAP processes into virtual machines.
In some cases a vMotion migration might not succeed and instead fails back due-to a rapidly changing volatile memory space, which can be the case with partitioned data-grid cluster and in some cases also replicated data-grid. The fail back is a fail-safe mechanism to the source virtual machine and it does not impact the source virtual machine.
vMotion makes this fail back decision based on the time it takes to complete the iterative copy process that captures changes between the source virtual machine to the destination virtual machine.
If the changes are too rapid and vMotion is not able to complete the iterative copy within the default 100 seconds, it checks whether it can failsafe to the running source virtual machine without interruption. Therefore, vMotion only transfers the source virtual machine to the destination if it is certain that it can complete the memory copy.
VMware HA and XAP
VMware HA should be disabled on virtual machines running XAP. If this is a dedicated XAP Grid DRS cluster, you can disable HA across the cluster. For a shared cluster, it is important to exclude XAP virtual machines from HA. Set up anti-affinity rules between the virtual machines running XAP preventing primary and backup of the same partition to run on the same ESX host within the DRS cluster.