Monitoring
The Monitoring view lets you view Processing Unit Infrastructure and Processing Unit properties statistics. XAP provides
default templates for this but all default dashboard templates can be changed. These are located under [XAP_HOME]/config/webui/dashboards.
The monitoring view relies on InfluxDB. InfluxDB is used to store the time series values that are generated from the XAP infrastructure. Grafana is embedded within the XAP web UI and connects to InfluxDB to visualise the time series data that is stored there.
InfluxDB currently runs only on Linux. If you have a repository that runs on Windows, you can implement your own custom reporter to integrate with the repository.
InfluxDB
Please refer to the InfluxDB website for installation instructions. Once InfluxDB is installed you need to create two data bases and then connect XAP to the repositories. Follow the steps below to configure InfluxDB and connect your XAP environment to it.
Create the databases
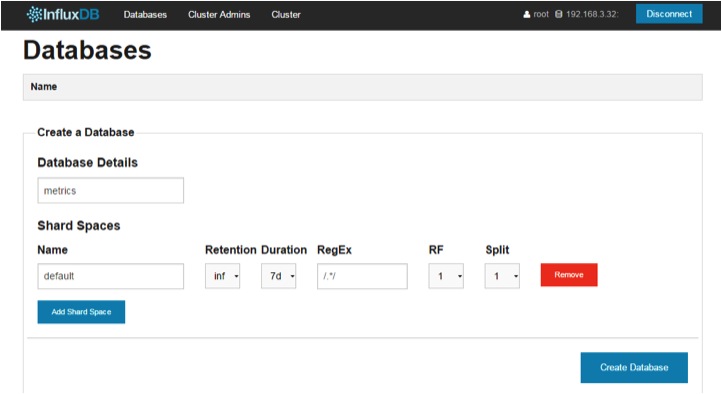
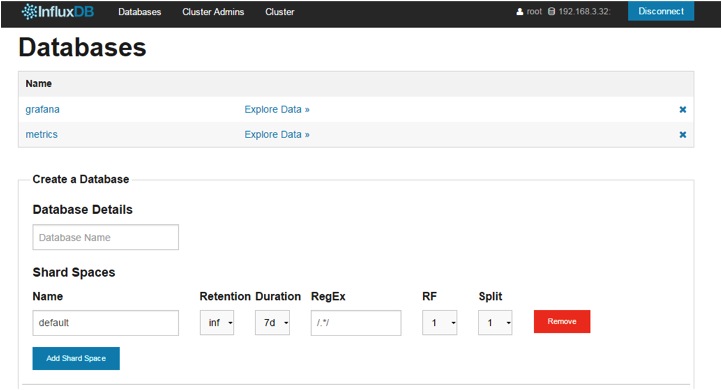
After you installed the InfluxDB, login into the web console and create two data bases that will be used by XAP to store the time series values.
The first data base we will call metrics and the second one is called grafana.
Creating the databases:
Configuration
Web UI Configuration
By Default InfluxDB uses ports 8083, 8086, 8090, and 8099. This conflicts with the default port for GigaSpaces Web UI Managment Console (8099). If you have Influxdb and XAP WEB UI on the same host you must change the default ports for Influxdb or the WebUI.
Refer to Starting the Web Management Console for more information on the Web UI.
#Specify port via a command line argument
./gs-webui.sh -port 80

#Specify port with a system property
export WEBUI_PORT=80
./gs-webui.sh
#Specify port via a command line argument
gs-webui.bat -port 80

#Specify port with a system property
set WEBUI_PORT=80
gs-webui.bat
XAP Configuration
Once the databases are created we need to configure the connection between XAP and InfluxDB. This is done by modifying the metrics.xml file which you can find in the XAP distribution
folder [XAP_HOME]/config/metrics.
First we configure the reporters:
<metrics-configuration>
    <reporters>
        <reporter name="influxdb-http">
            <property name="host" value="influxdb-host"/>
            <property name="database" value="metrics"/>
            <property name="username" value="root"/>
            <property name="password" value="root"/>
        </reporter>
    </reporters>
</metrics-configuration>
Please refer to the InfluxDB Reporter section for detailed configuration instructions.
Then we configure the dashboard connection for Grafana:
   <grafana>
        <datasources>
            <datasource name="influxdb">
                <property name="type" value="influxdb"/>
                <property name="url" value="http://influxdb-host:8086/db/metrics"/>
                <property name="username" value="root"/>
                <property name="password" value="root"/>
            </datasource>
            <datasource name="grafana">
                <property name="type" value="influxdb"/>
                <property name="url" value="http://influxdb-host:8086/db/grafana"/>
                <property name="username" value="root"/>
                <property name="password" value="root"/>
                <property name="grafanaDB" value="true"/>
            </datasource>
        </datasources>
    </grafana>
Please note that Grafana is fully client-side therefore even if InfluxDB is installed on the same host as the web UI the URL needs to be reachable by the client node accessing the UI.
Once this configuration is complete and XAP is restarted we are now ready to start visualising our metrics. Our XAP infrastructure should now be connected and writing data to InfluxDB with the default configuration.
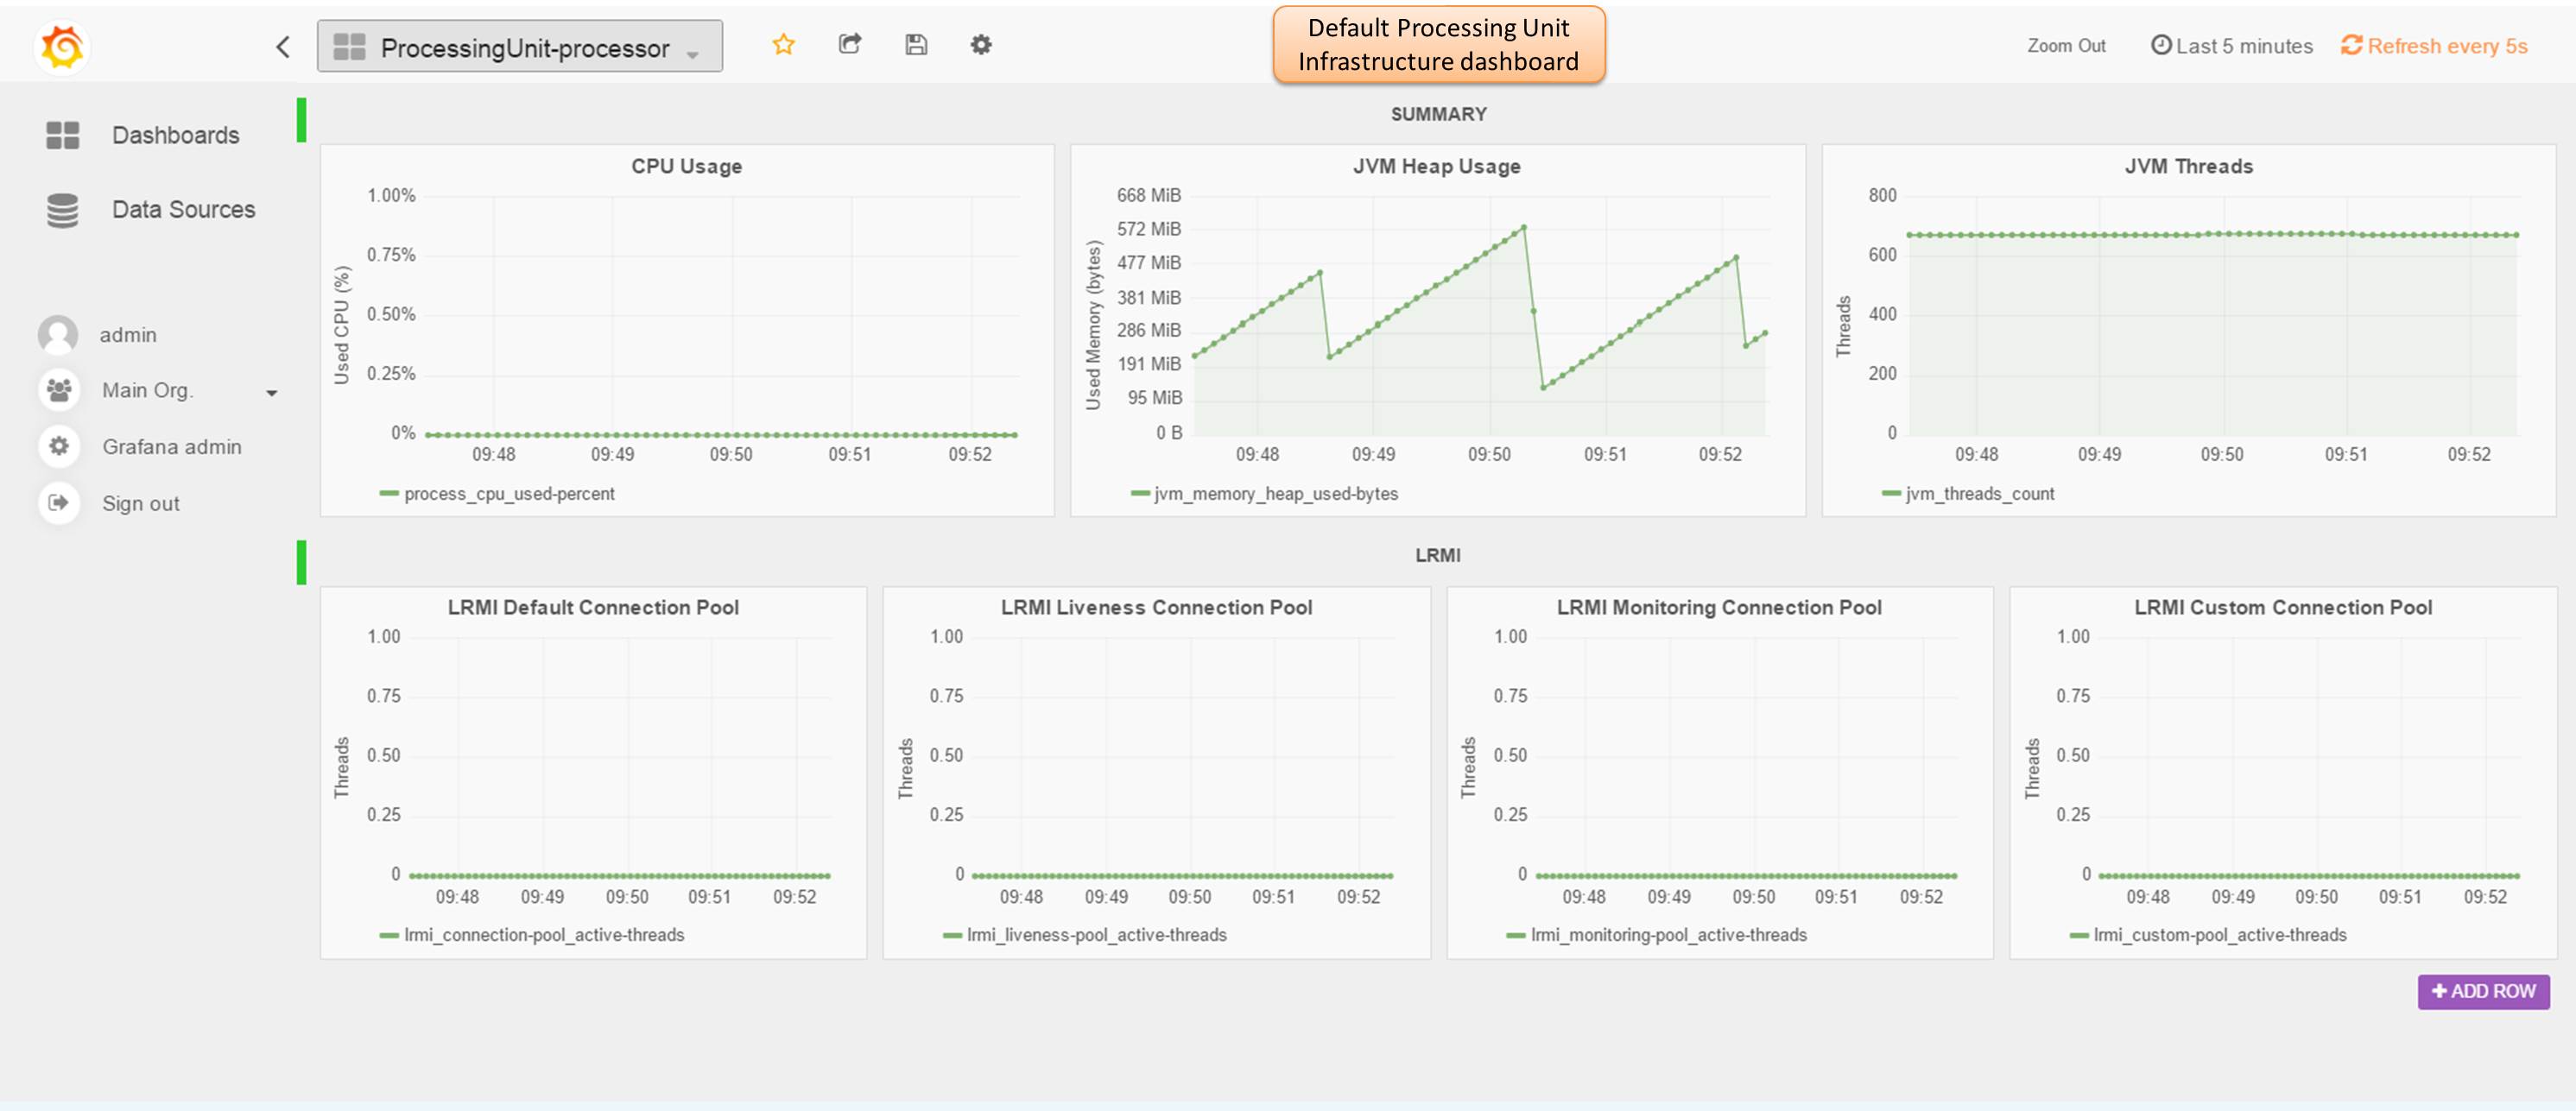
Monitor view
When you open the Monitor tab in the XAP web console, you will see the following view:
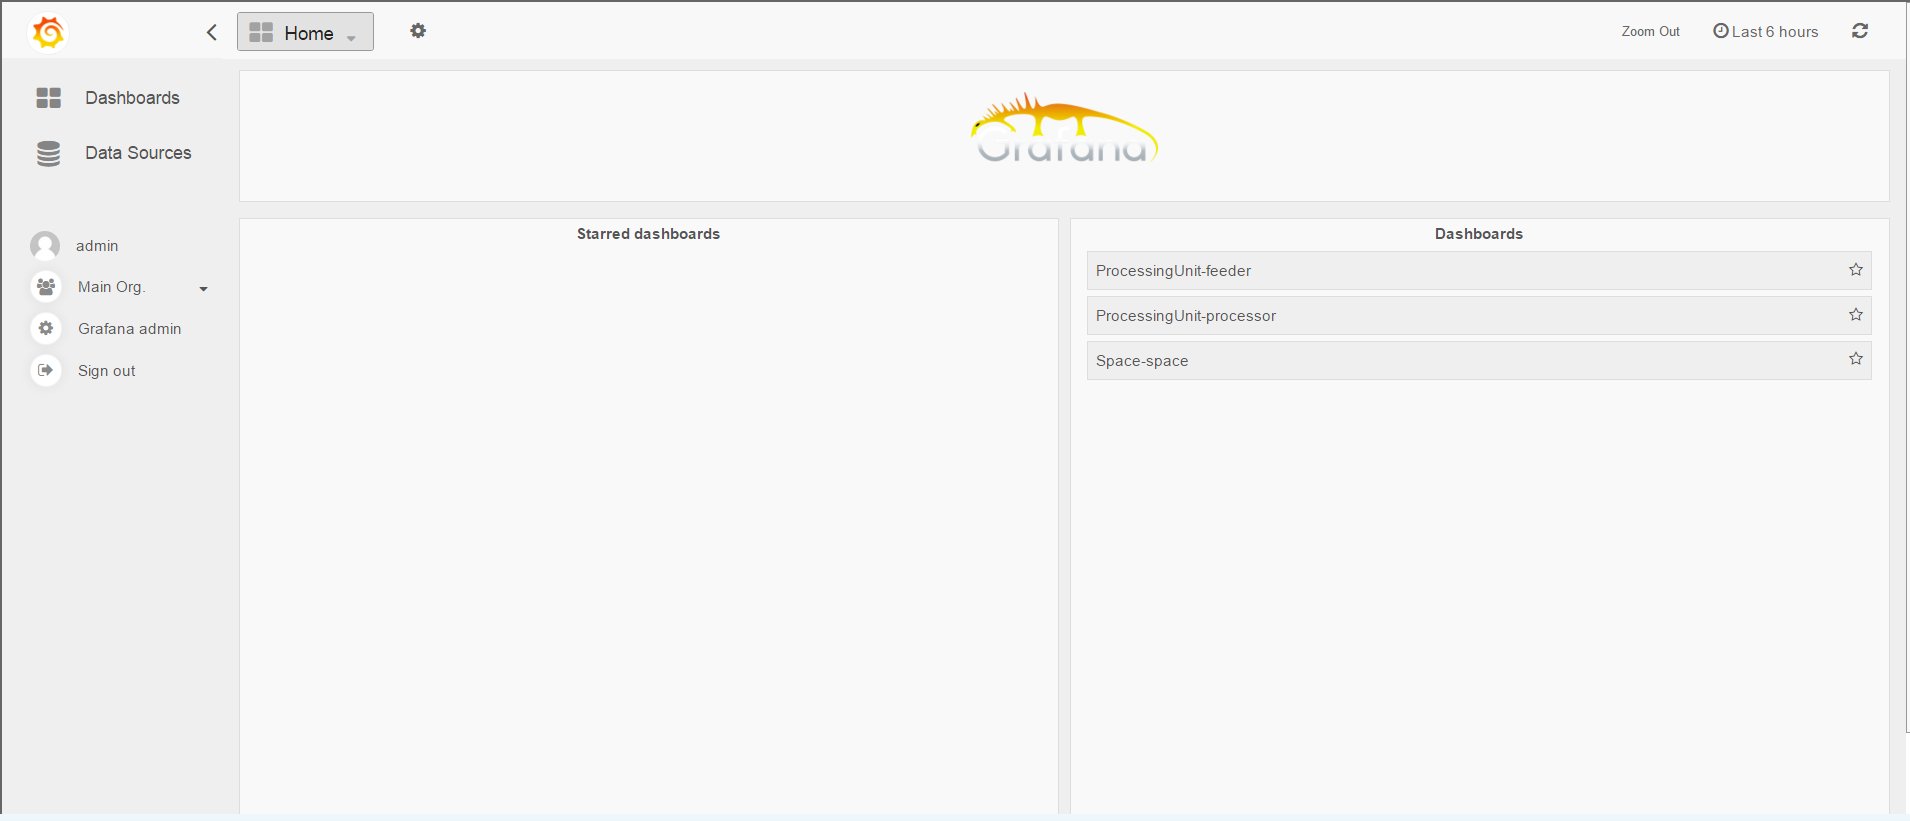
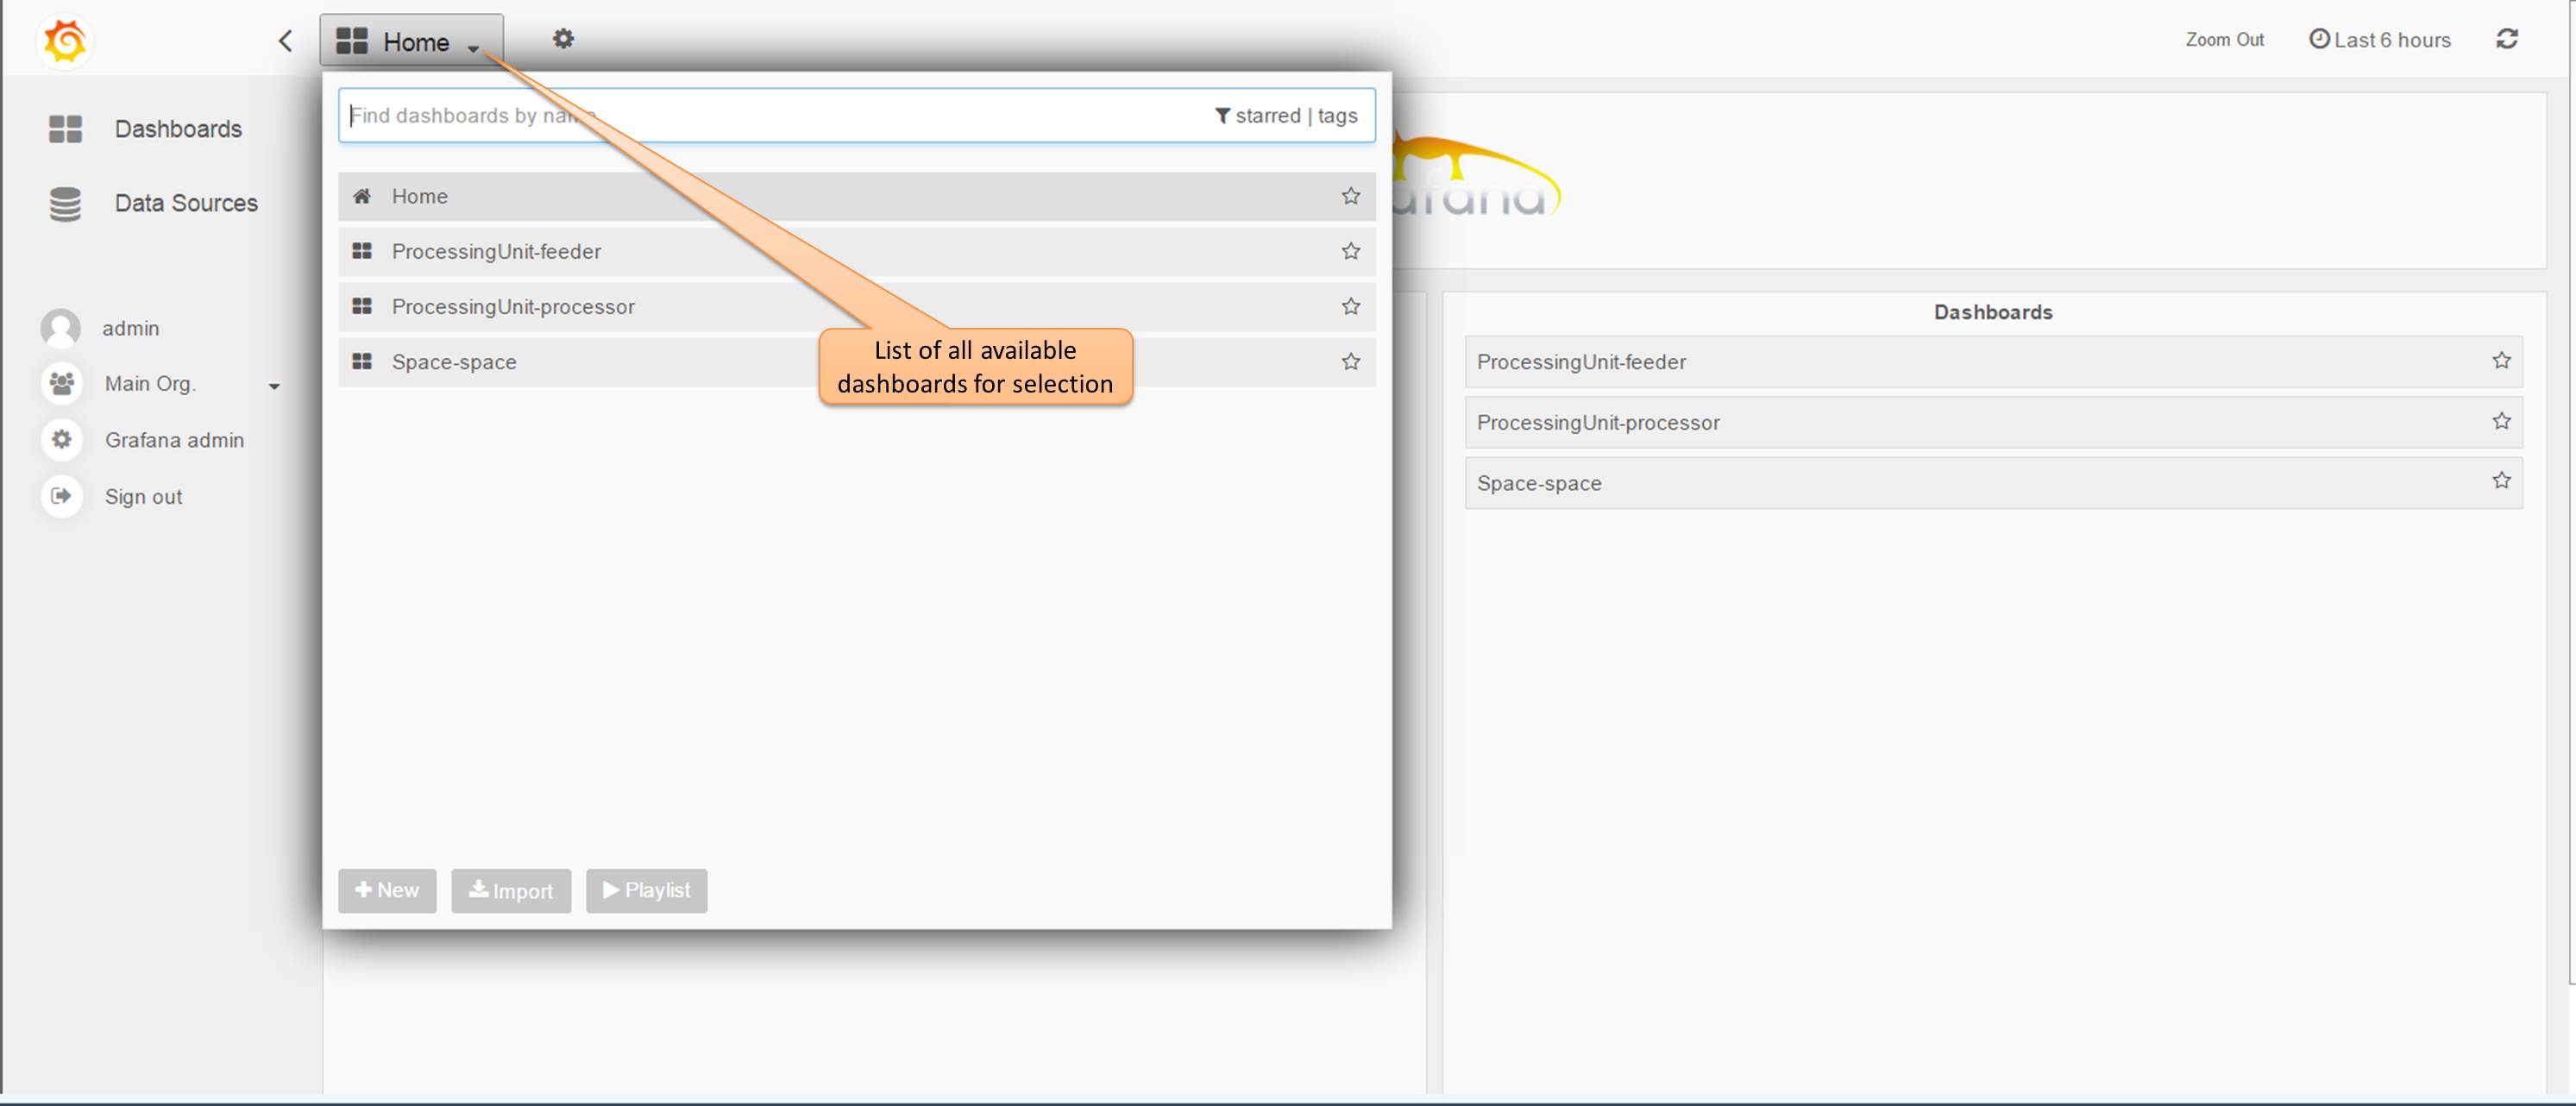
Dashboards
By selecting the folder icon on the right in the menu bar, the available dashboards will be displayed:
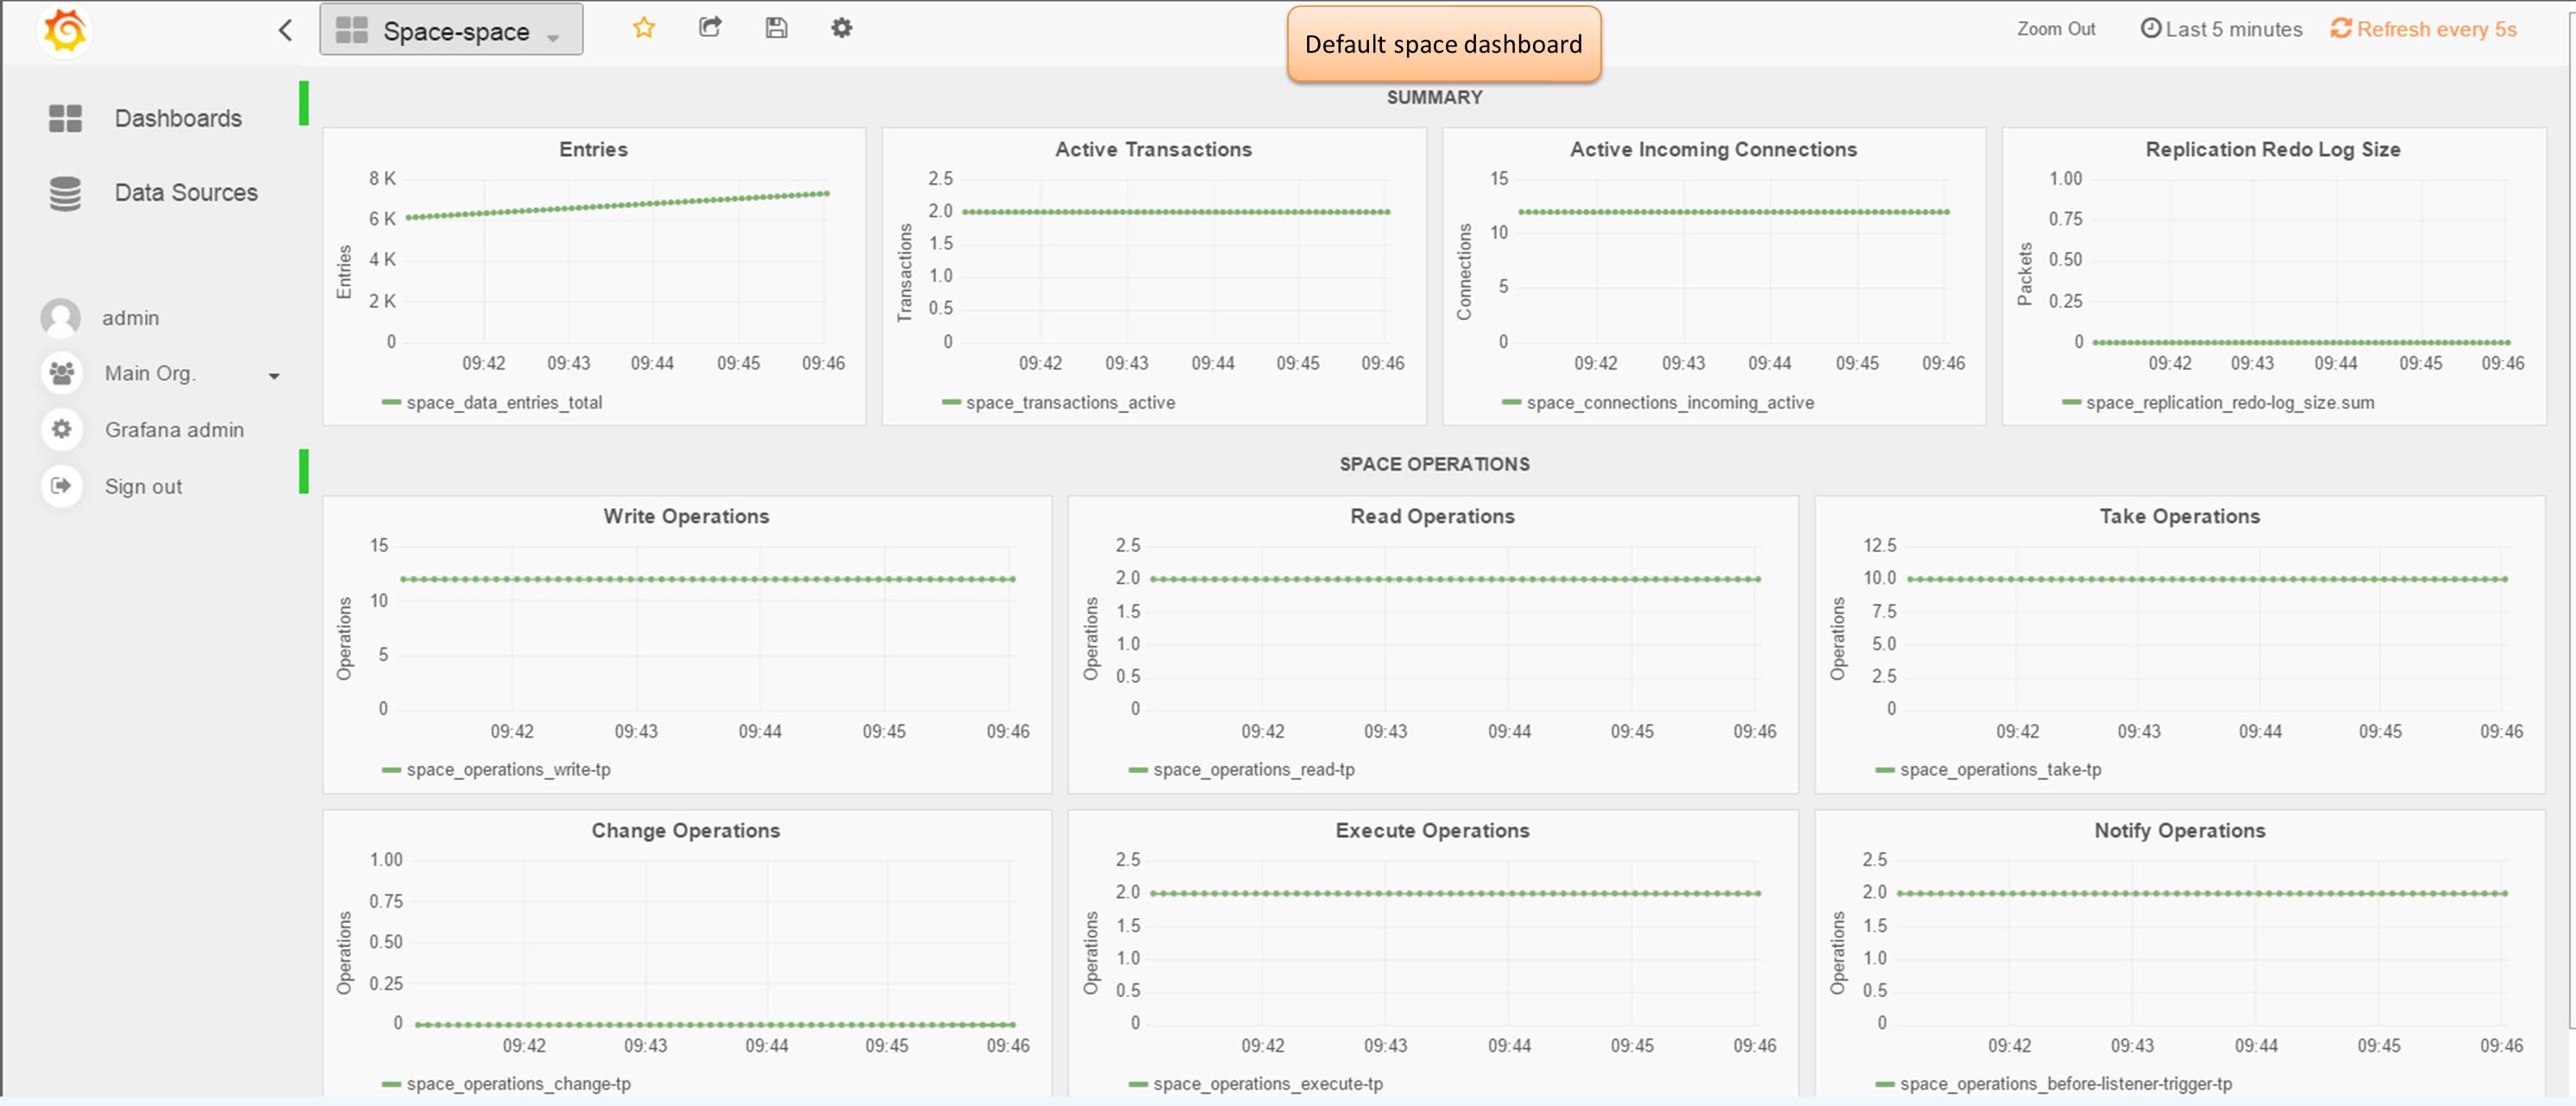
Default Space dashboard
Default Processing Unit dashboard