CA APM Introscope Reporter
CA APM helps to monitor applications and react quickly when certain performance issues may occur. XAP provides many metrics like: processing units, spaces and machines that compose the grid. The metrics can be reported to Instroscope, so that its advanced features might be used to further analyze metrics data. XAP CA APM Introscope Reporter provides a way to send XAP related metrics to Introscope.
XAP-apm-introscope requires a separate license in addition to the XAP commercial license, please contact GigaSpaces Customer Support for more details.
Architecture
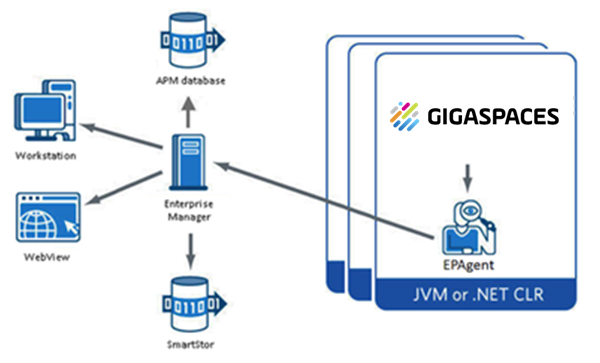
The major components of CA Introscope are the Enterprise Manager, CA Introscope agents, Workstation, WebView, SmartStor, and APM database as shown in the graphic above. Many smaller components are explained in the CA Introscope product documentation.
Enterprise Manager
The Enterprise Manager acts as the repository of CA Introscope performance metrics. The Enterprise Manager receives performance metrics from one or more CA Introscope agents, allowing users to collect metrics centrally from many applications, application servers, and supporting systems. You can deploy the Enterprise Managers in different ways depending on the size and complexity of the enterprise system. The role of a specific Enterprise Manager depends on how it is deployed in a standalone or in a clustered CA APM environment.
Agents
CA Introscope agents collect and report several types of application and environmental performance metrics. One agent is deployed per process (Java Virtual Machine [JVM] or .NET CLR instance). The total number of agents depends on the size of the CA Introscope deployment, for example: A small pilot network uses as few as half a dozen agents to monitor a few test applications. A large extended enterprise production environment uses hundreds or thousands of agents to monitor applications across the enterprise.
CA Introscope agents collect performance metrics from several sources: - The various components inside the running application - The application server - Performance and availability data from the surrounding computing environment. - The agents then report these metrics to the Enterprise Manager.
You can import real-time generic and non-Java data into CA Introscope through modified version of the agent named the Environment Performance Agent (EPA or EPAgent). EPA uses simple scripts that allow CA Introscope to monitor virtually any type of application subsystem impacting performance. For example, using EPA CA Introscope can monitor directory servers, operating systems and messaging middleware.
XAP Integration
Features
XAP-CA APM-introscope introduces the following features:
- reporting metrics to Introscope (more details)
- inserting hierarchy into metrics (more details)
- modifying reported metrics names and values to conform to Introscope requirements (more details).
Requirements
- CA APM Introscope 9.6 environment. The integration was tested with CA APM Introscope 9.6 however, higher versions (at least 9.x) should also integrate properly.
- Enable network input to Introscope, Introscope reporter in XAP metrics configured (more details).
Configuration
We will show you how to configure a working environment with XAP sending metrics information to CA Introscope.
Basic configuration
The steps below use only basic configuration without getting into details, more information is available here.
- Edit
IntroscopeEPAgent.propertiesfile: add lineintroscope.epagent.config.networkDataPort=MY_PORT(by default this line is commented), whereMY_PORTshould be replaced with a port number, on which EPAgent will wait for data. - Make sure that port
MY_PORTis open on a machine where EPAgent will be deployed. - Edit
$GS_HOME/config/metrics/metrics.xmlfile: add the following piece of XML code toreportersnode (MY_PORTshould be replaced with a value from the previous point,MY_HOSTwith IP address or hostname of a machine where EPAgent will be deployed):
    <reporter name="introscopeReporter" factory-class="com.gigaspaces.metrics.IntroscopeReporterFactory">
        <property name="host" value="MY_HOST"/>
        <property name="port" value="MY_PORT"/>
    </reporter>
Starting Introscope and XAP
- Start the Introscope environment (setup instructions cab be found here).
- Start the XAP grid by running the following command:
$GS_HOME/bin/gs-agent.sh.
Observing metrics
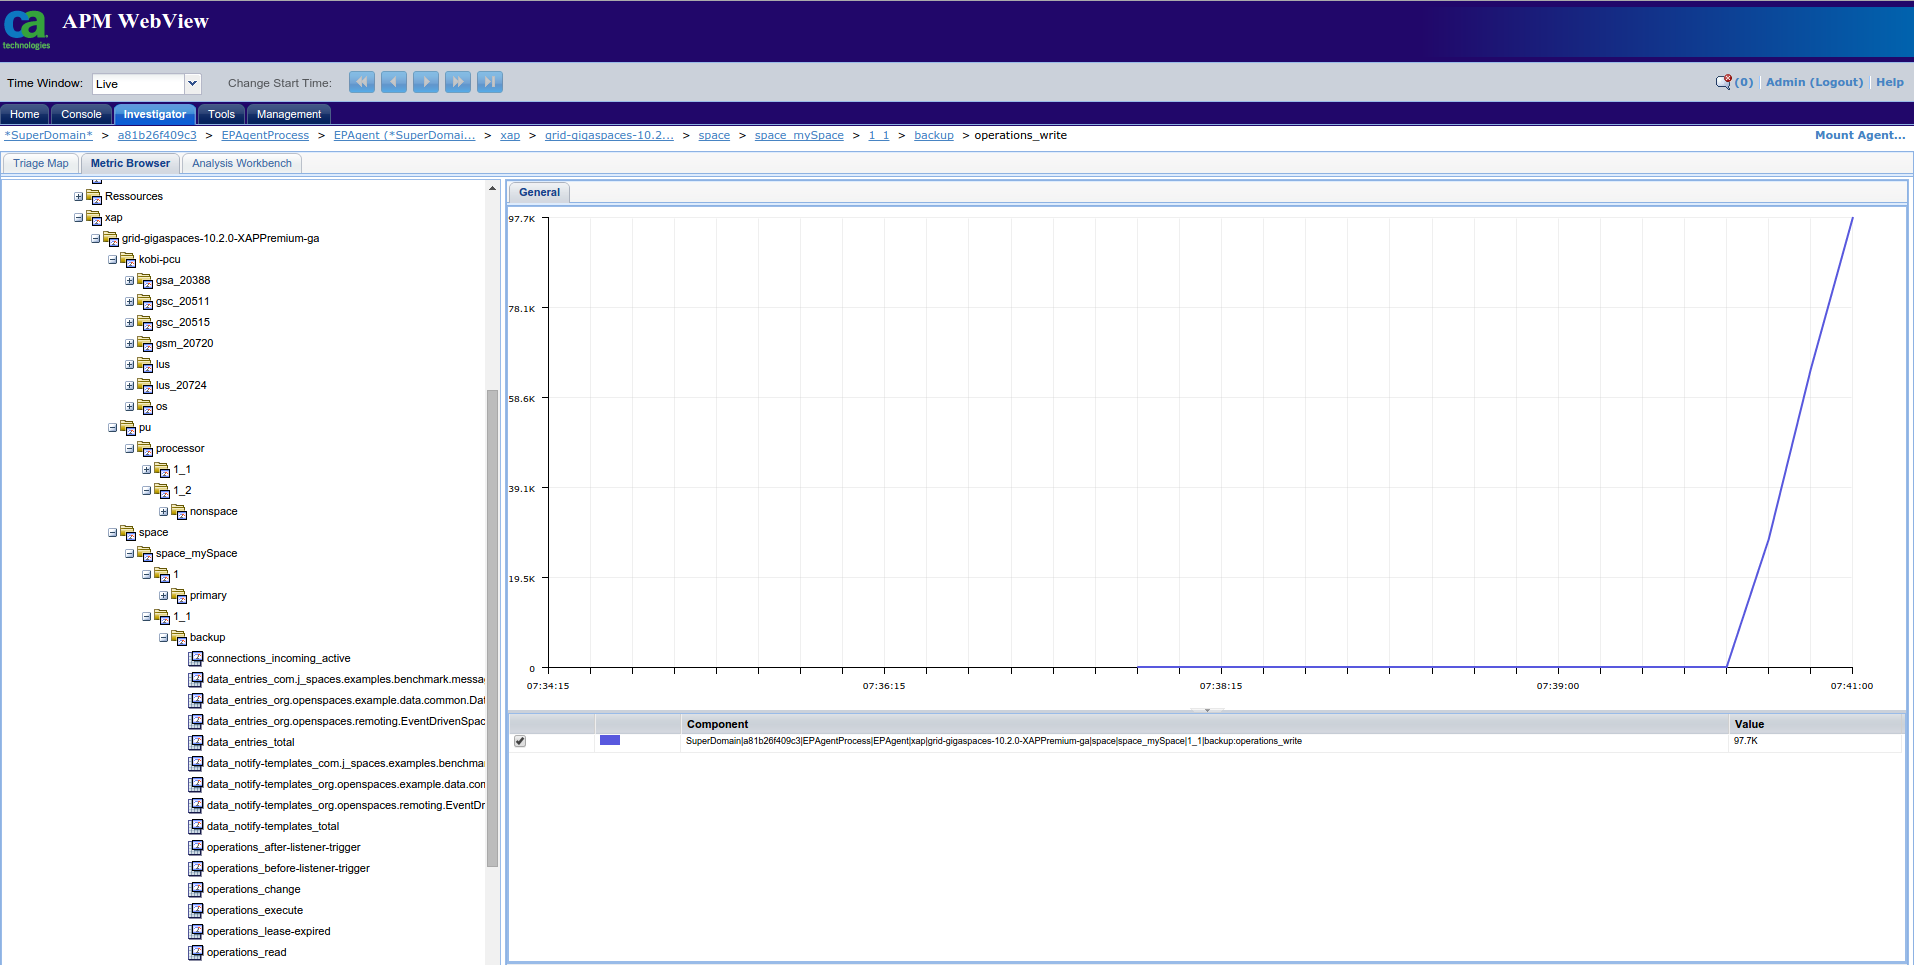
- Log in to webview.
- Go to
Investigatortab, thenMetric Browsertab. - Node
*SuperDomain*/XAP host/EPAgentProcess/EPAgent(*SuperDomain*)should contain a sub-nodexapthat is the root of all metrics reported by XAP.
Configuration
To properly work, XAP-apm-introscope requires a some configuration on both sides, Introscope and XAP.
Introscope properties
XAP-apm-introscope communicates with EPAgent deployed in an Introscope environment. It requires EPAgent to listen on a certain port for metrics data. To enable receiving metrics from network, property introscope.epagent.config.networkDataPort should be uncommented in IntroscopeEPAgent.properties (by default this is EPAgent configuration file, in case another file is used, described steps should be performed on that file) and set to port on which EPAgent will listen for metrics data, e.g.
introscope.epagent.config.networkDataPort=8003
XAP metrics configuration
File $GS_HOME/config/metrics/metrics.xml contains XAP metrics configuration. The part important for XAP-apm-introscope is a list of reporters - IntroscopeReporter must be added to it. Moreover, it has two mandatory properties:
- host - hostname or ip address of a machine with EPAgent. Mandatory.
- port - port on which EPAgent listens for metrics data. This value has to match
introscope.epagent.config.networkDataPortproperty described in the previous paragraph. Mandatory. - hierarchy_pattern - This is an optional property. Pattern used to build name of the highest level of hierarchy. It may contain a
{lookuplocator}or{lookupgroup}substrings, which will be replaced by current lookuplocator or lookupgroup, respectively. If output of pattern conversion is empty or contains{or}signs, then it will be recognized as invalid and anIllegalArgumentExceptionwill be thrown. This property is optional, since it has default value{lookupgroup}-{lookuplocator}.
Below config to be included within the metrics.xml file:
    <reporters>
        <reporter name="introscopeReporter" factory-class="com.gigaspaces.metrics.IntroscopeReporterFactory">
            <property name="host" value="127.0.0.1"/>
            <property name="port" value="8000"/>
            <property name="hierarchy_pattern" value="grid-{lookupgroup}"/>
        </reporter>
    ...
    </reporters>
Integration details
This paragraph describes the important aspects of XAP-CA APM Introscope integration.
Integration with XAP
XAP provides a well defined point of integration - custom reporter. The integration is implemented based on XAP metrix framework:
- IntroscopeRepoter - the main class that handles sending metrics inherits from MetricReporter,
- IntroscopeRepoterFactory - a class that creates reporters derives from MetricReporterFactory.
Integration with CA APM Introscope
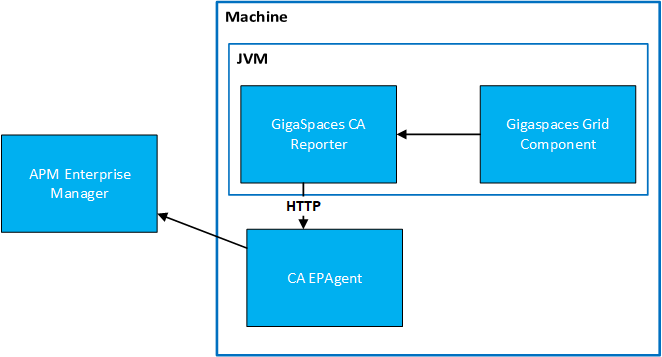
Introscope gathers metrics data from applications using agents. It provides several agents - one agent per one web framework. However, this functionality is not needed to integrate with XAP, since all metrics are already being gathered by XAP. The problem lies in reporting data to Introscope. This task can be solved by EPAgent.
EPAgent
EPAgent (Environment Performance Agent) is a special type of agent that is used to monitor system wide or user defined statistics. It is a natural point of integration with XAP. There are several ways of sending data to EPAgent: plugins, simple HTTP server, network communication.
Plugins - EPAgent allows users to define custom plugins that are either separate programs or Java classes run by
EPAgent.HTTP Server -
EPAgent(in Introscope 9.6) can create a simple HTTP server. In that case metrics are reported by sending GET requests with metric data (metric name, type, value) in query to the server.Network communication -
EPAgentmay expose a port on which it will listen for requests containing metric data.
Integration by plugins would require additional work, because plugin semantics is that it pulls data, while the desired behavior is to accept data sent by XAP. The second method conforms to this requirement, however, it is not scalable, since one request carries only one metric value. Obviously, it would cause too much overhead. Moreover, this feature is deprecated and may be removed from Introscope. The last proposal solves all those issues: EPAgent listens for data and one requests contains multiple entries.
Security warning
EPAgent accepts all data that it receives via network (i.e. without authentication). Therefore, access to it must be limited by firewall.
Data format
EPAgent accepts metric data that is sent in specific format. Otherwise, it may log erroneus values or does not log them at all. Each line should contain data for one measured value. There are two formats for a single line: simple format or XML format. The latter one was chosen, since it provides more control over reported data (less restrictions on metric name, possibility to specify type of value).
Format of each line is as follows:
<metric type="TYPE" name="NAME" value="VALUE" />
There are three fields that need to be populated: type, name and value. Only the first one requires a short comment. Introscope has few types of metrics defined. Some of them are connected with a little bit of logic - e.g. Introscope may compute average value of all reported values.
However, XAP-apm-introscope uses only the most basic ones - LongCounter for numerical data and StringEvent for others, because statistics are already processed by XAP and need only to be exported to Introscope.
Below is an example of metric data sent to Introscope:
<metric type="LongCounter" name="xap|groupA|myhost|lus|20237:lus_items" value="1" />
<metric type="LongCounter" name="xap|groupA|myhost|lus|20237:lus_pending-events" value="0" />
<metric type="LongCounter" name="xap|groupA|space|space_metricsSpace|0|primary:operations_lease-expired" value="100" />
Timestamps warning
There is no possibility to tie metric data with timestamp. Introscope connects a single metric report with the time it was received by Introscope, not sent by XAP. This means that sending metrics in batch should be disabled, when integrating both systems.
Hierarchy insertion
XAP reports tens of different predefined metrics per machine that belongs to a grid, deployed processing units or Space (you can find more information here). Additionally, there might be also custom metrics defined by users. Even for one machine, number of metrics becomes too high for human-being to track them easily in webview in flat format. Hierarchy is inserted by modifying metric name - it has the given format:
RESOURCE_SEGMENT_1|...|RESOURCE_SEGMENT_N:METRIC_NAME
Resource segments are optional. They are separated from name by : and are separated from each other by |. Multiple resource segments create hierarchy, e.g. metrics xap|groupA|myhost|lus|21950:lus_items and xap|groupA|myhost|lus|21950:lus_listeners can be seen as:
xap
+-- groupA
  +-- myhost
    +-- lus
      +-- 21950
        --- lus_items
        --- lus_listeners
As you see these have a tree like format. IntroscopeReporter takes care of inserting hierarchy into predefined metrics, while custom metrics are reported without any name modifications.
Metrics conversions
Important task of IntroscopeReporter is to convert received metrics to Introscope format. The format was described in the previous paragraph, this paragraph lists all conversions done on metrics.
Metrics hierarchy
Inserting hierarchy into metric name depends on an initial metric name and available additional data retrieved from MetricTagsSnapshot. XAP comes with predefined metrics and hierarchy related conversions are performed for such metrics, while custom metrics names are almost untouched.
Operating system metrics
OS metrics name starts with os_. IntroscopeReporter performs different conversion on network related and non-network related statistics.
OS metrics / network metrics
Metric name starts with os_network_.
Format: xap|$TOP_LEVEL|$HOST|os|network|$NIC:METRIC_NAME_WITHOUT_PREFIX
| Before conversion | After conversion |
|---|---|
| os_network_rx-bytes | ``` xap |
OS metrics / non-network metrics
Metric name starts with os_ and not with os_network_.
Format: xap|$TOP_LEVEL|$HOST|os|others:METRIC_NAME
| Before conversion | After conversion |
|---|---|
| os_memory_free-bytes | `xap |
Process|JVM|LRMI metrics
Those metrics start with “process”, “jvm” or “lrmi_“. There are 2 subtypes - metrics for specific pu or process-wide (e.g. for GSA, GSC, etc.).
Process|JVM|LRMI metrics / per PU
Metric tags contain pu_name key.
Format: xap|$TOP_LEVEL|pu|$PU_NAME|$PU_INSTANCE_ID:METRIC_NAME
| Before conversion | After conversion |
|---|---|
| jvm_threads_count | `xap |
Process|JVM|LRMI metrics / process-wide
Metric tags do not contain pu_name key.
Format: xap|$TOP_LEVEL|$HOST|$PROCESS_NAME_$PID:METRIC_NAME
| Before conversion | After conversion |
|---|---|
| jvm_threads_count | `xap |
Lookup service metrics
Metric name has a lus_ prefix.
Format: xap|$TOP_LEVEL|$HOST|lus|$PID:METRIC_NAME
| Before conversion | After conversion |
|---|---|
| lus_items | `xap |
Processing unit metrics
Metric name has a pu_ prefix.
Format: xap|$TOP_LEVEL|pu|$PU_NAME|$PU_INSTANCE_ID:METRIC_NAME_WITHOUT_PREFIX
| Before conversion | After conversion |
|---|---|
| pu_data ProcessorPollingEventContainer _processed-events |
`xap |
Space metrics
Space metrics name starts with “space_“. Metrics for primary and backup are converted a little bit different.
Space metrics / primary partition
Metric tag space_instance_id contains only numbers.
Format: xap|$TOP_LEVEL|space|$SPACE_NAME|primary$SPACE_INSTANCE_ID:METRIC_NAME_WITHOUT_PREFIX
| Before conversion | After conversion |
|---|---|
| space_operations_take | `xap |
Space metrics / backup partition
Metric tag space_instance_id does not consist only of numbers.
Format: xap|$TOP_LEVEL|space|space_$SPACE_NAME|backup$SPACE_INSTANCE_ID:METRIC_NAME_WITHOUT_PREFIX
| Before conversion | After conversion |
|---|---|
| space_operations_take | `xap |
Other metrics
Metrics that do not meet conditions of any types presented above, are considered as others and almost no conversion is performed on them.
Format: xap|$TOPLEVEL:METRIC_NAME
| Before conversion | After conversion |
|---|---|
| custom_metric | `xap |
Data types
The XAP-apm-introscope uses two types of metrics: LongCounter and StringEvent. LongCounter is reserved for numerical values - if an object representing metric value inherits from Numerical, it is supposed to be logged as LongCounter. Otherwise, metric type would be StringEvent.
A String object with numerical value (e.g. “0”) would be recognized as StringEvent.
Introscope metrics requirements
Introscope adds a few constraints on metrics and IntroscopeReporter conforms to all of them by modifying metric names or values.
Metric name and resource segments are cleaned from special signs, i.e. : and |. If a full name contains more than one resource-name separator (:), then this metric will not be logged at all. If any of resource segments contains resouce-resource separator (|), then a hierarchy level will be split.
Metric value of LongCounter type must carry integer value. Unfortunately, Introscope does not have any separate type for floats/doubles. Therefore, all numeric values are rounded. There are a few predefined metrics that suffer a little from this constraint (e.g. process_cpu_used-percent). However, those values are from 0 to 100 and in most cases reporting 65 instead of 64.7 is acceptable. It is worth to remember about this requirement if custom metrics with narrow range of values (e.g. from 0.0 to 1.0) may be defined - in this case it could make sense to report values multiplied by 10, 100, etc.
Development environment installation steps
Steps below describe how to set up development environment to start working on this plugin. Filed required: - EPAgent9.6.0.0unix.tar, - introscope9.6.0.0otherUnix.jar, - osgiPackages.v9.6.0.0.unix.tar
- Install
dockeranddocker-compose. - Clone repo
https://github.com/stefansiegl/docker-introscope.git. - Copy
introscope9.6.0.0otherUnix.jarandosgiPackages.v9.6.0.0.unix.tarto docker-introscope/enterprise-manager/9.6.0.0, docker-introscope/sample/9.6.0.0 and docker-introscope/webview/9.6.0.0. - Copy
EPAgent9.6.0.0unix.tarto docker-introscope/sample/9.6.0.0. - Edit file docker-introscope/sample/9.6.0.0/IntroscopeEPAgent.properties, in section EPAgent Configuration uncomment line containing
introscope.epagent.config.networkDataPortand change port if the default one is taken. - Edit file docker-introscope/sample/9.6.0.0/run-default-sample-container.sh and open port used in the previous point by adding
-p PORT:PORTto thedocker runcommand, wherePORTshould be substituted with a proper port number. - Run command:
docker-compose -f docker-compose-with-sample.yml up - Open your browser on a page
webview-ip:8080 (webview-ipis an IP adress of docker container), type: user:Adminand password leave empty. In case you receive HTTP 404 error, wait a minute, because server used in webview needs a little time to start working.