SpaceDeck – Spaces Status - Details
Spaces Status Details
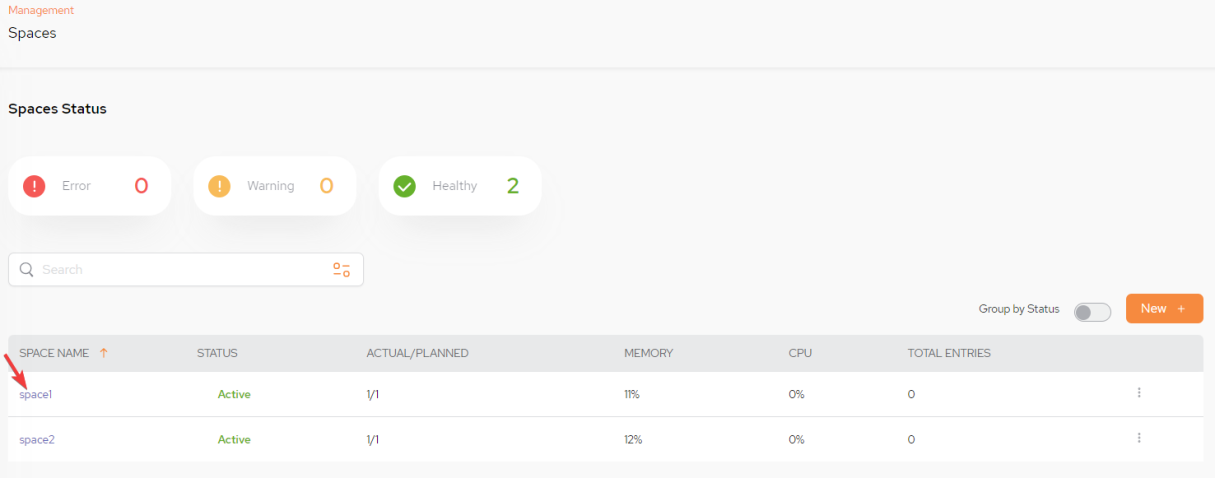
When viewing the Spaces main screen, by clicking a Space![]() Where GigaSpaces data is stored. It is the logical cache that holds data objects in memory and might also hold them in layered in tiering. Data is hosted from multiple SoRs, consolidated as a unified data model. name, detailed information on the Space can be accessed:
Where GigaSpaces data is stored. It is the logical cache that holds data objects in memory and might also hold them in layered in tiering. Data is hosted from multiple SoRs, consolidated as a unified data model. name, detailed information on the Space can be accessed:
The resulting screen has three tabs: Monitoring, Space Types, and Partitions
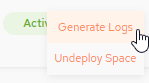
A log can be generated or a space can be undeployed by selecting the kebab menu (vertical three-dot menu) on the far top right:
![]()
Then select either Generate Logs or Undeploy Space:
View Space Details – Monitoring
The Monitoring tab displays graphs showing various Space-related statistics.
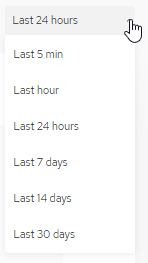
Note that a drop-down list on the right side of the screen allows you to change the reported time interval:
The following graphs are available:
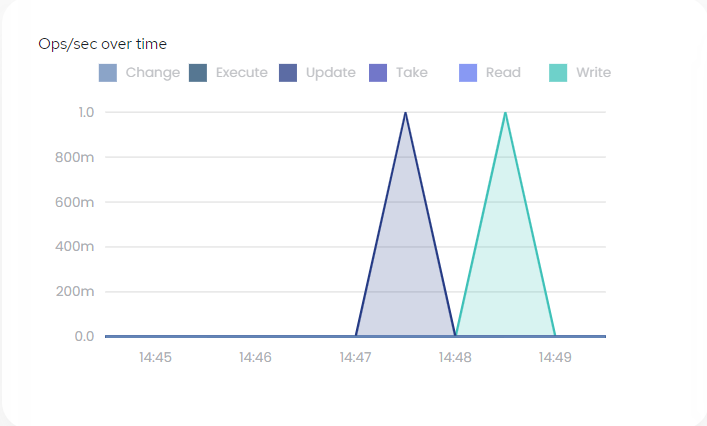
Ops/Sec Over Time
This graph shows the I/O operations over time. You can click the operation type (Read, Write, etc.) or select them all for all operation types (default),
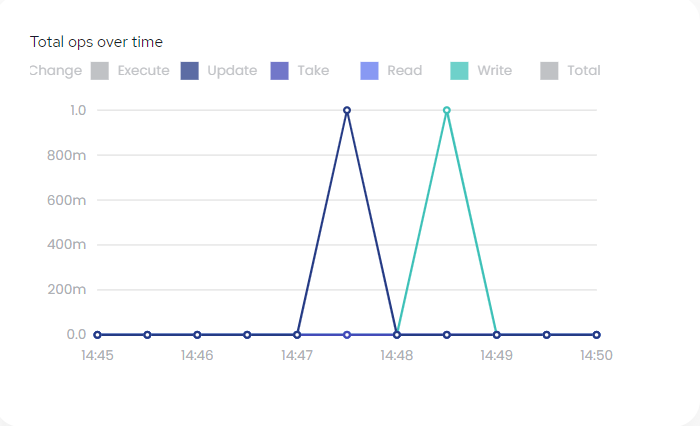
Total Ops Over Time
This graph shows the total I/O operations over time. You can click the operation type (Execute, Update, etc.) or view the Total for all operation types (default),
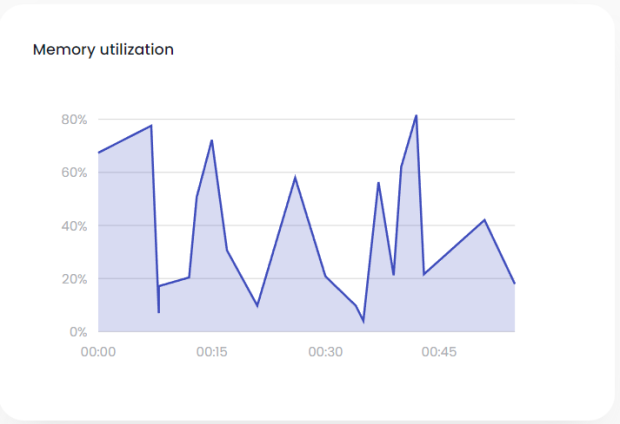
Memory Utilization
This graph displays the memory utilization over time, as the percent of memory used in the Space.
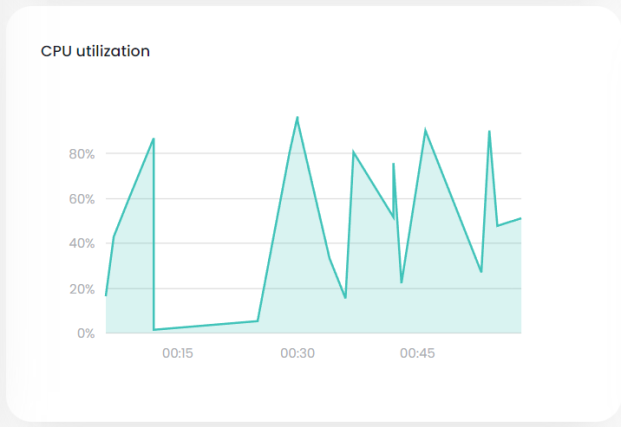
CPU Utilization
This graph displays the percent of the CPU that was used in the Space.
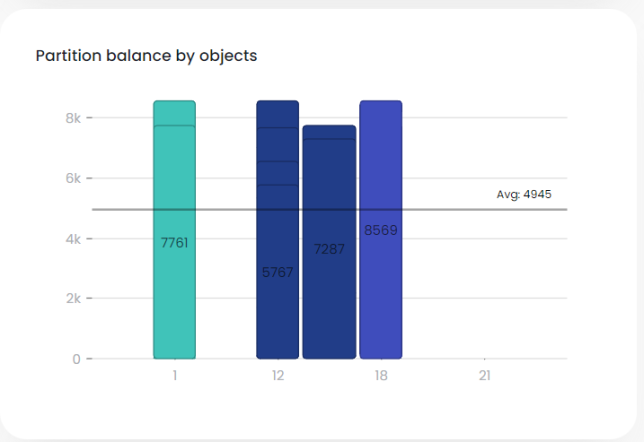
Partition Balance by Objects
These bar charts show up to five instances (object types) with the highest number of objects (rows). The
average line indicates the average number of objects for all object types.
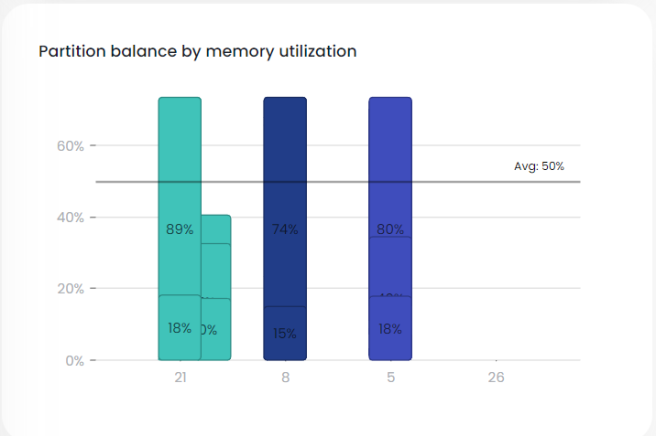
Partition Balance by Memory Utilization
These bar charts show up to five instances (object types) with the highest memory usage. The
average line indicates the average memory usage for all object types.
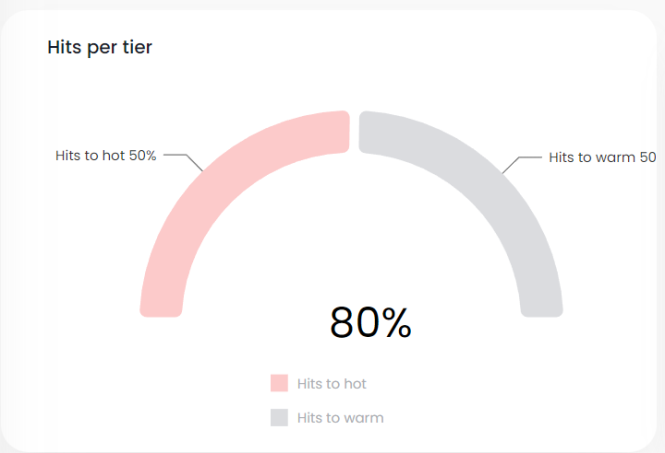
Tiered Storage – Hits Per Tier
If Tiered Storage![]() Automatically assigns data to different categories of storage types based on considerations of cost, performance, availability, and recovery. has not been defined, the following tiered storage graphs will not be displayed.
Automatically assigns data to different categories of storage types based on considerations of cost, performance, availability, and recovery. has not been defined, the following tiered storage graphs will not be displayed.
This graphs shows the Tiered Storage hit to hot storage (RAM memory; left side of graph) and to warm storage (SSD memory; right side of graph).
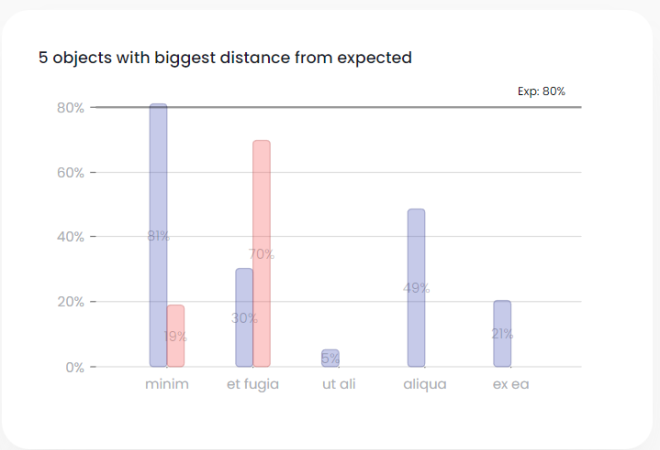
Tiered Storage – Five Objects with Biggest Distance From Expected
This graphs shows up to five Tiered Storage objects with the greatest divergence from the expected usage. You can scroll this graph to show all objects in descending order (by distance from expected).
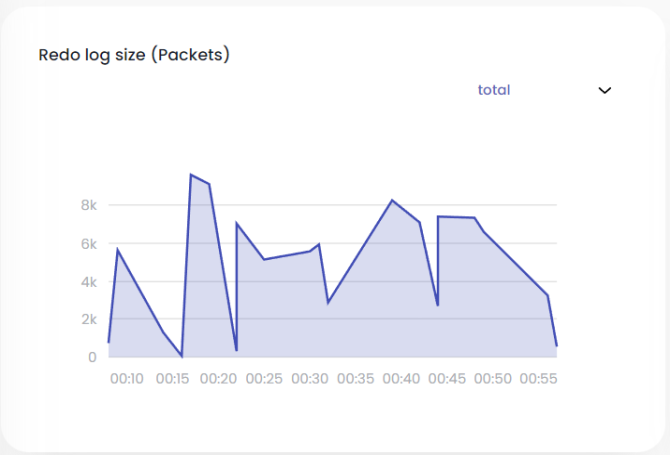
Redo Log – Redo Log Size
If Redo Log has not been defined, the following redo log graphs will not be displayed.
This graph shows the size of the redo log over time.
Note that you can click the drop-down list (total in this example) to specify a specific instance.
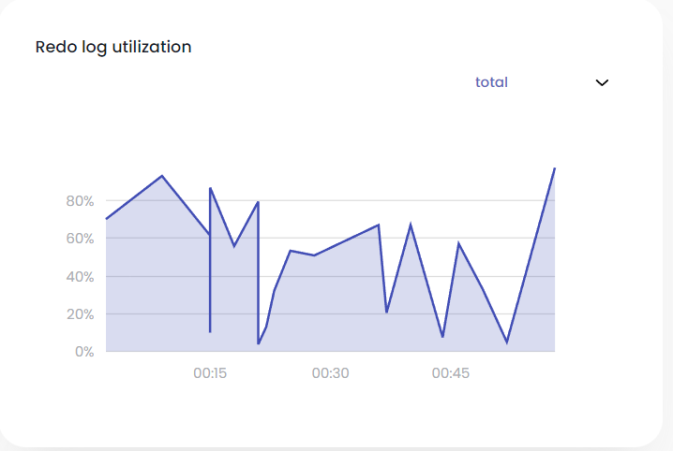
Redo Log – Redo Log Utilization
This graph shows the percent of the redo log memory that was used over time.
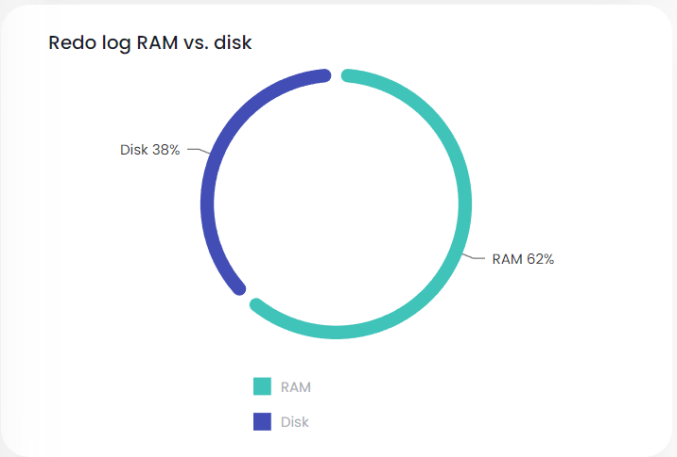
Redo Log – CPU Utilization
This graph shows the percentage of the redo log that is currently in RAM and in SSD.
View Space Details – Space Types
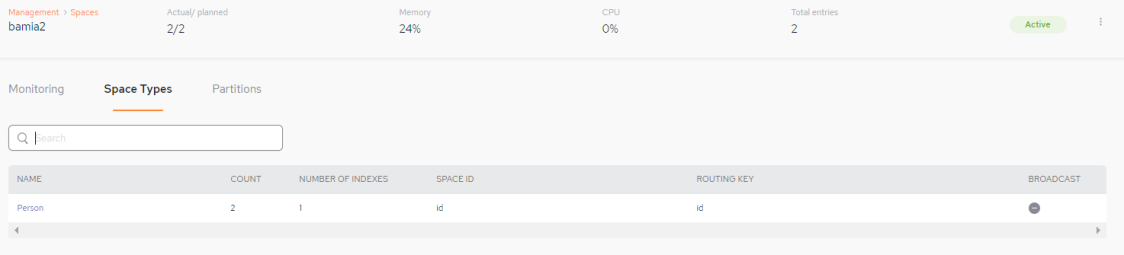
The Space Types tab displays a list of the Space types (tables) associated with the Space.
View Space Types – Summary Information
Each row represents one table in the Space. The Space Types fields are as follows:
- NAME — Name of the object-type
- COUNT — The number of rows in the object-type
- NUMBER OF INDEXES — The number of indexes defined for the object-type
- SPACE ID — The GigaSpaces Space object that contains the object-type data
- ROUTING
 The mechanism that is in charge of routing the objects into and out of the corresponding partitions. The routing is based on a designated attribute inside the objects that are written to the Space, called the Routing Index. KEY — The identifier that will be used by GigaSpaces to distribute the data among multiple partitions
 - BROADCAST – Whether or not this object type is in a Space that is a Broadcast Object
Click one of the Space Types to see detailed information for the object type's properties and indexes. The Space Types information is divided into three categories: General information, Properties, and Indexes.
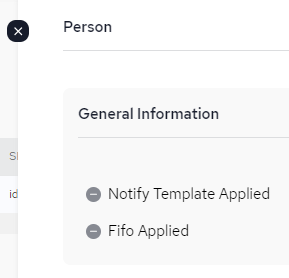
- Notify Template Applied — Indication of whether the Space subscribes to Space events and provides a listener mechanism – see Notifications
- Fifo Applied — Apply FIFO FIFO is an acronym for first in, first out, a method for organizing the manipulation of a data structure where the oldest entry, or "head" of the queue, is processed first. (First In, First Out) behavior – see FIFO Support
View Space Types – Properties
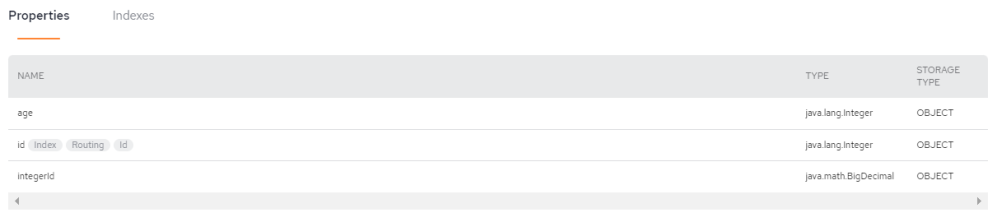
- NAME — Name of the property (field)
- TYPE — Property type
- STORAGE TYPE — No storage compression (default) or storage compression
View Space Types – Indexes
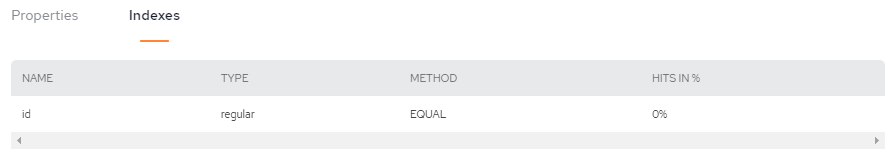
- NAME — Name of the index
- TYPE — Index type
- METHOD — Index method
- HITS IN % — The percent each index is used, compared to the overall queries of the specific object type.
View Space Details – Partitions
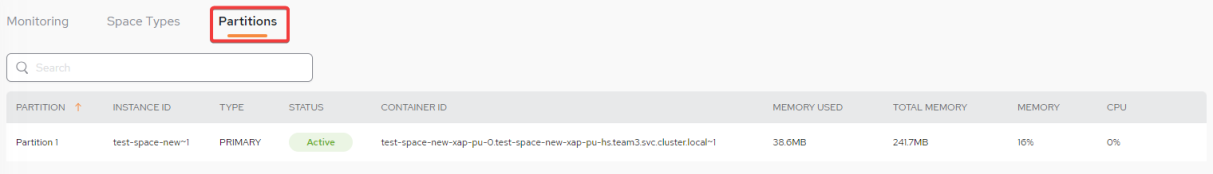
The Partitions tab displays details about the partitions where the Space data is stored.
- PARTITION — Partition Name
- INSTANCE ID — Each instance has its own instance ID
- TYPE — Can be PRIMARY or BACKUP
- STATUS — Can be Active or Error
- CONTAINER ID – The Kubernetes An open-source container orchestration system for automating software deployment, scaling, and management of containerized applications. container ID
- MEMORY USED – Current memory utilization
- TOTAL MEMORY - Total available memory
- MEMORY - Current memory used by percentage
- CPU — Current CPU utilization
For more information:
SpaceDeck – Spaces - Adding a Space