Using Grafana for Monitoring and Analytics
Overview
Monitoring a production environment of any system requires inspecting many statistics.
- History - Since statistics are polled and aggregated at runtime in memory, they're limited to a few minutes of history, whereas in production users often need to store metrics for a few days at least.
- Persistency - If the web server goes down, all statistics are lost.
- Scalability
 The ability of a system to handle increased load by adding resources, such as processing power or storage. Scalability ensures that the system can grow with the demands placed on it. - The web server gathers statistics by polling each component. This approach is not scalable, and does not behave well on large clusters.
To overcome these limitations, GigaSpaces also provides a powerful and versatile framework for reporting metrics. Each component can report its own predefined or user-defined metrics to any database or tool by implementing a metrics reporter. In addition, GigaSpaces provides a built-in reporter for InfluxDB and integration with Grafana![]() Grafana is a multi-platform open source analytics and interactive visualization web application. It provides charts, graphs, and alerts for the web when connected to supported data sources. to provide metrics storage and visualization:
Grafana is a multi-platform open source analytics and interactive visualization web application. It provides charts, graphs, and alerts for the web when connected to supported data sources. to provide metrics storage and visualization:
- InfluxDB is an open-source distributed time-series database with a powerful query language.
- Grafana is an enterprise tool for organizations with a graph and dashboard builder for visualizing time-series metrics, which supports InfluxDB (and other data sources).
When these metrics are enabled, GigaSpaces reports them to InfluxDB.
InfluxDB and Grafana are both open-source and free, but are not bundled in GigaSpaces distribution. Installation is straightforward, as described below. Note that GigaSpaces's default metrics configuration is set to match the default settings of InfluxDB and Grafana, so if this is your first time we recommend leaving the default configuration to simplify the process.
Installing and Configuring InfluxDB
To install InfluxDB (1.8.0 or earlier), download from here and follow the installation instructions.
To configure InfluxDB, edit the metrics.xml file, found under $GS_HOME/config/metrics for ServiceGrid. Change the following part according to your InfluxDB host (myhost) and database name (mydb) that stores metrics:
<grafana> <datasources> <datasource name="influxdb"> <property name="type" value="influxdb"/> <property name="url" value="http://myhost:8086/db/mydb"/> <property name="username" value="root"/> <property name="password" value="root"/> </datasource></datasources> </grafana>
In a Kubernetes![]() An open-source container orchestration system for automating software deployment, scaling, and management of containerized applications. environment, InfluxDB will be installed as part of the dih umbrella.
An open-source container orchestration system for automating software deployment, scaling, and management of containerized applications. environment, InfluxDB will be installed as part of the dih umbrella.
Installing and Configuring Grafana
To install Grafana (6.7.3 or earlier), download from here, and follow the installation instructions.
Starting with Grafana version 6.2.0, the following flag in the defaults.ini file should be set to true in order to allow opening grafana within our web-ui:
allow_embedding=true
After installation, you need to configure Grafana to work with GigaSpaces's metrics configuration, which is located at $GS_HOME/charts/xap-manager/config/metrics.xml for Kubernetes, and at $GS_HOME/config/metrics/metrics.xml for ServiceGrid. Assuming you've installed InfluxDB and Grafana without changing the defaults, all you need to do is uncomment the InfluxDB reporter and grafana elements, as shown below:
<metrics-configuration>
    <reporters>
        <reporter name="influxdb">
            <property name="host" value="localhost"/>
            <property name="database" value="mydb"/>
        </reporter>
    </reporters>
    <grafana url="http://localhost:3000" api-key="" user="admin" password="admin">
        <datasources>
            <datasource name="xap">
                <property name="type" value="influxdb"/>
                <property name="isDefault" value="true"/>
                <property name="url" value="http://localhost:8086"/>
                <property name="database" value="mydb"/>
                <property name="access" value="proxy"/>
            </datasource>
        </datasources>
    </grafana>
</metrics-configuration>
reporter- InfluxDB installation automatically creates a database calledmydb, which matches the default. See InfluxDB Reporter for information about other optional settings.grafana- Grafana installation defaults to port3000with username/passwordadmin/admin. In production you'll probably change those in Grafana, so make sure to change them inmetrics.xmlas well. Even better, you can generate an API key in Grafana and place it in theapi-keyattribute.datasource- This tells Grafana how to connect to your InfluxDB database. Note that InfluxDB uses port8086by default for an API endpoint, and that we're connecting to the defaultmydbdatabase.
We recommend verifying that the default database exists. Some InfluxDB packages do not automatically create the default mydb database. You can use the InfluxDB Web Admin or shell to check if the database exists, and create it if needed. For more information, see the Getting Started with InfluxDB topic on the InfluxDB website .
In a Kubernetes environment, Grafana will be installed as part of the dih umbrella.
Getting Started
Dashboards
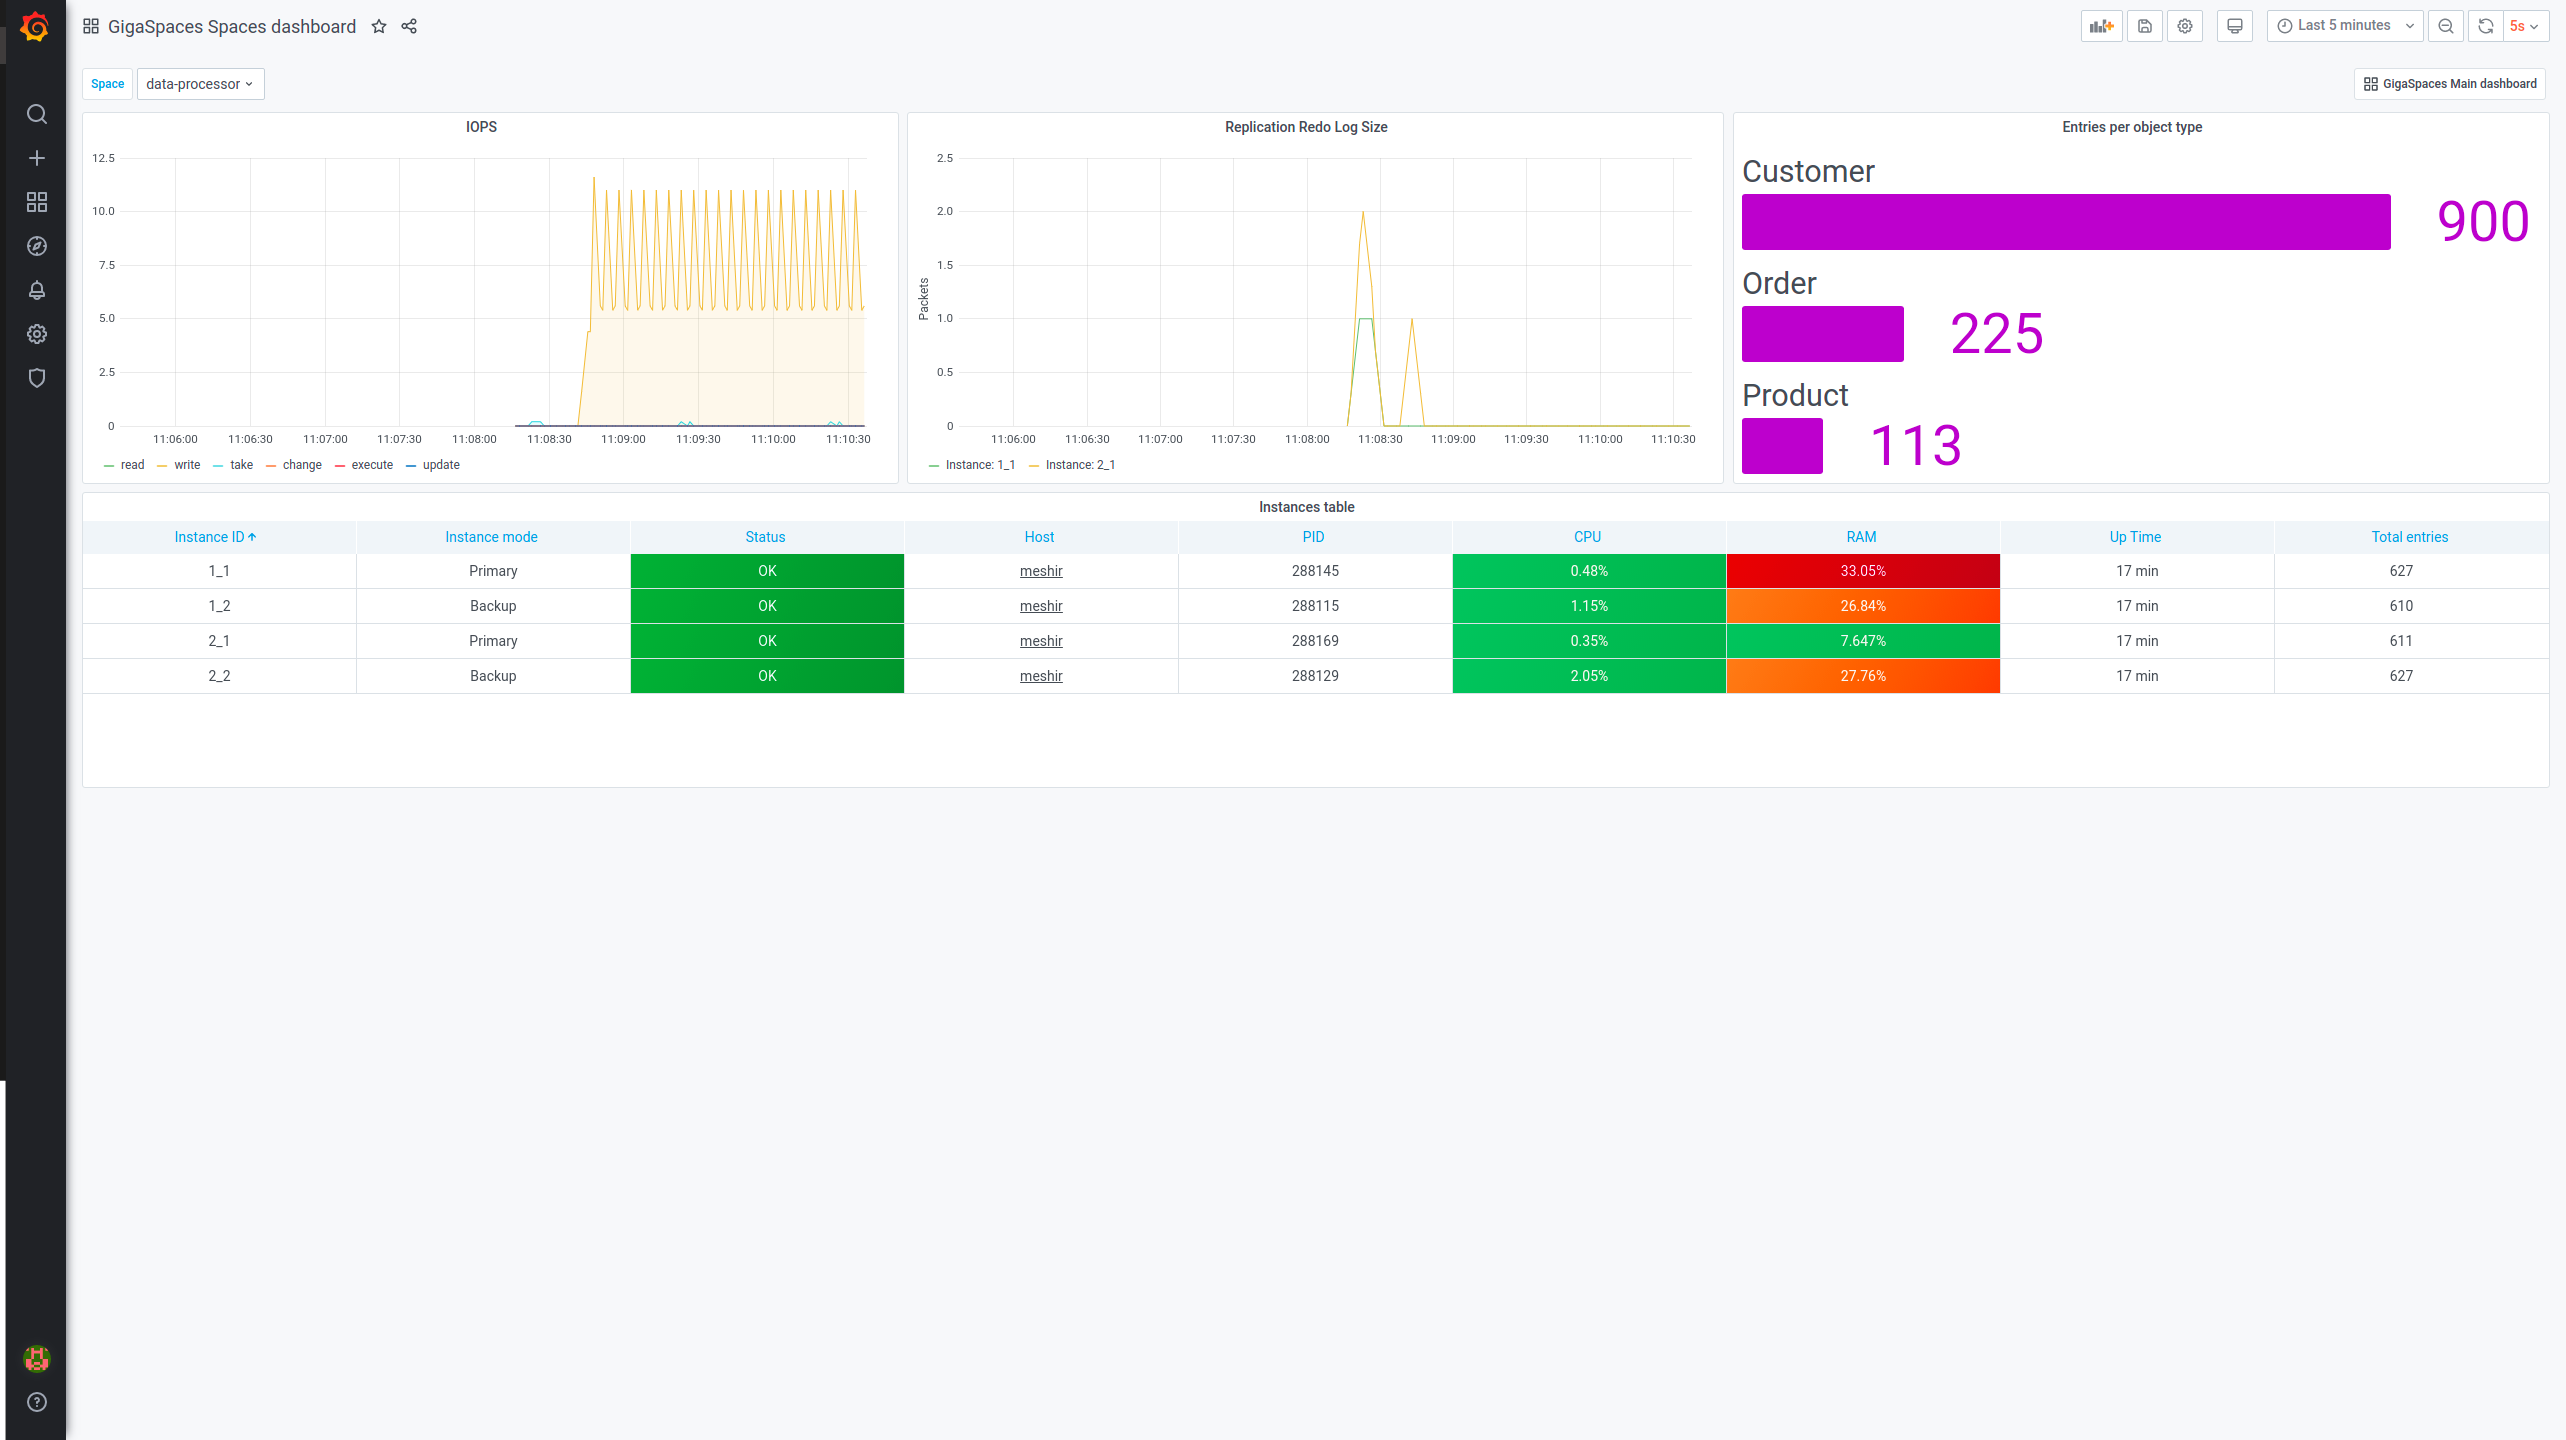
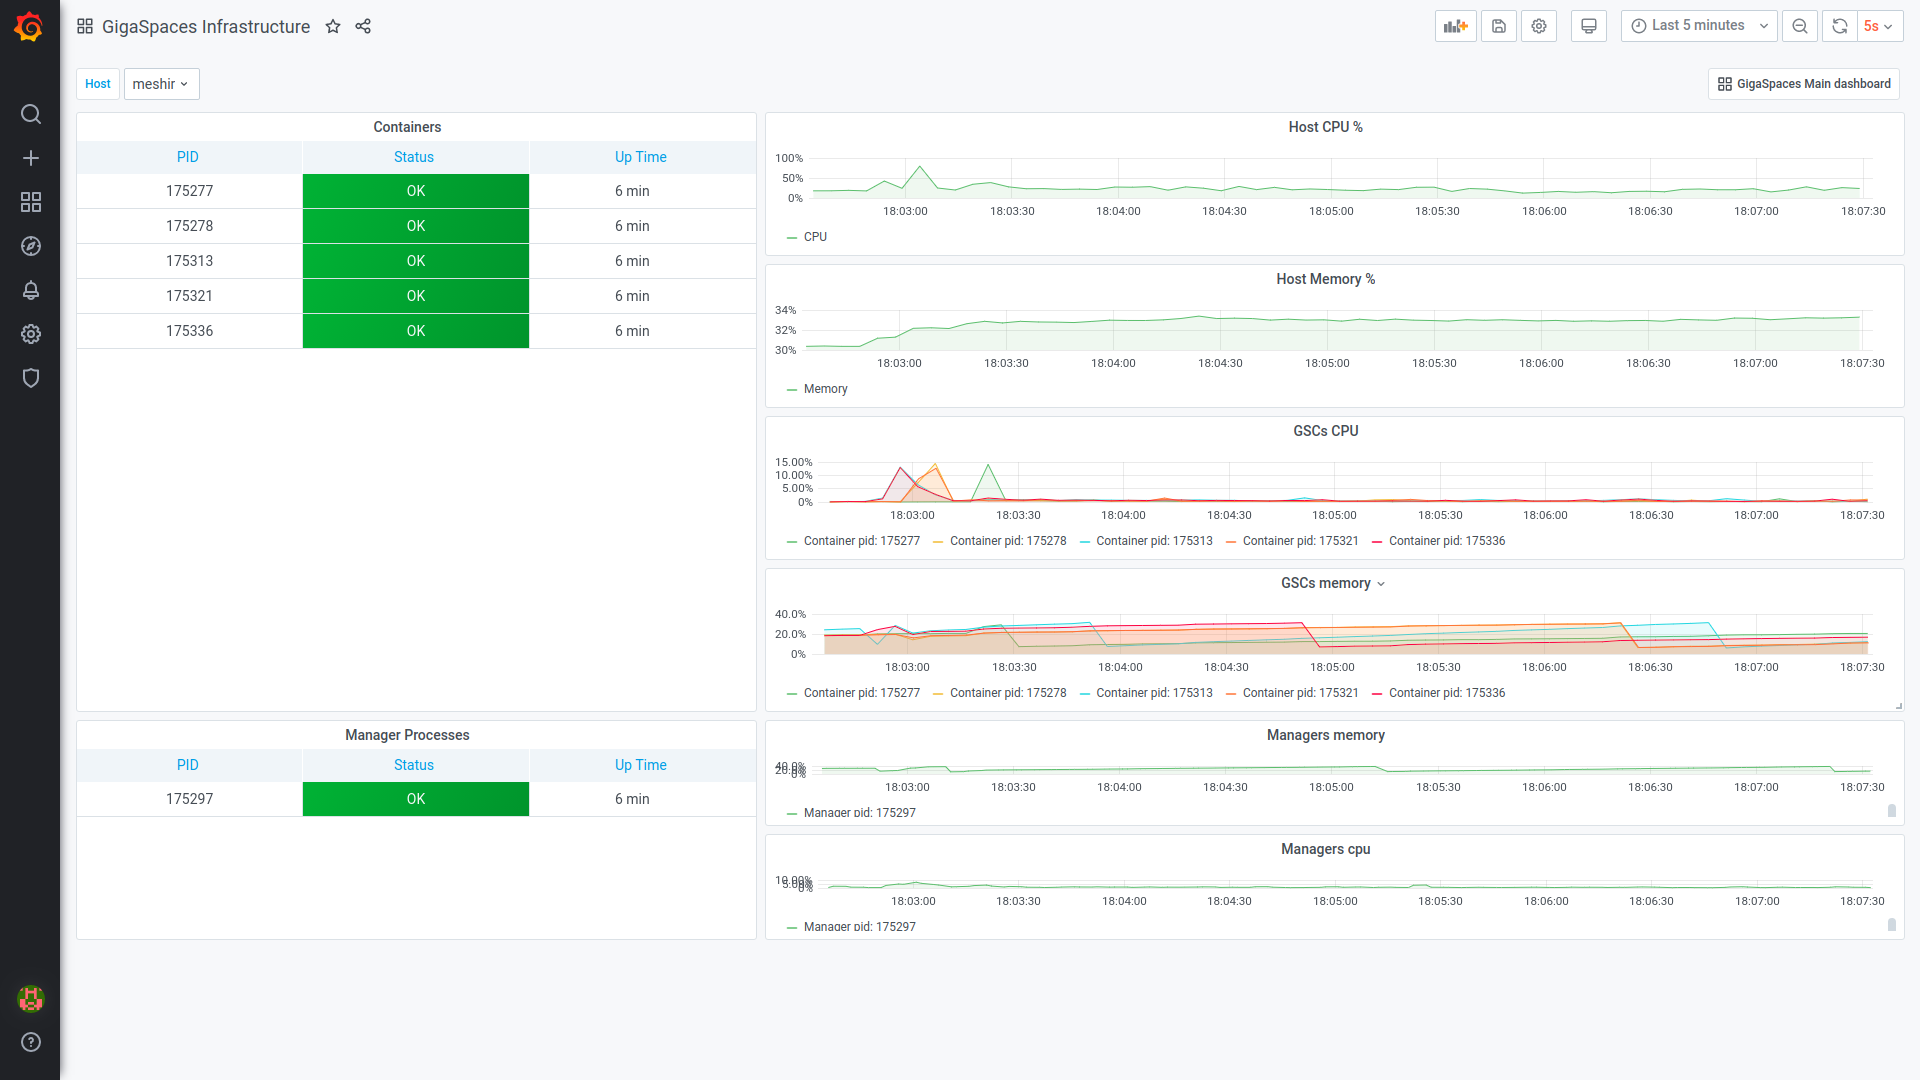
Following are examples of predefined dashboards.
In a non-Kubernetes environment, you will need to import the dashboards from $GS_HOME/config/grafana/dashboards.
In a Kubernetes environment, the Grafana dashboards are pre-installed.
GigaSpaces Spaces Dashboard
GigaSpaces Infrastructure
How to Disable Metrics in a Kubernetes Environment
By default, metrics are automatically enabled during product installation.
If you wish to disable metrics, proceed as follows:
-
Create a chart with dependencies to other charts (known as an umbrella chart
In Kubernetes, A helm umbrella chart is when a chart is created for the purpose of grouping together related subcharts/services, such as to compose a whole application or deployment.) which are completely external, using the requirements.yamlfile (a YAML file listing dependencies for the chart). -
In the installation of the umbrella chart, include the following parameter:
-- set metrics.enabled=false
Configure Alerts in a Kubernetes environment
Kapacitor chart is part of the default umbrella, which allows monitoring and alerts on time series data.
To use Kapacitor alerts, include the following parameters when installing a new chart:
-
kapacitor.smtp.enabled - enable the SMTP service for sending alert mails.
-
kapacitor.smtp.to - list of recipient email addresses.
-
kapacitor.smtp.from - the email address Kapacitor will use to send alerts.
-
kapacitor.smtp.username - the SMTP username. This is an optional parameter, set it if your SMTP server requires authentication.
-
kapacitor.smtp.password - the SMTP password. This is an optional parameter, set it if your SMTP server requires authentication.
For example:
--set kapacitor.smtp.enabled=true, kapacitor.smtp.to=your-to-mail@mail.com, kapacitor.smtp.from=your-from-mail@mail.com
Each of following predefined alerts has the properties enabled (default value: true ), value (default value: depends on alert) and writeToLog (default value: true):
-
kapacitor.alerts.dihFlinkJobRunningState
-
kapacitor.alerts.dihFlinkJobCancellingState
-
kapacitor.alerts.dihFlinkJobFailingState
-
kapacitor.alerts.dihFlinkJobRestartingState
-
kapacitor.alerts.dihFlinkJobManagerTaskSlots
-
kapacitor.alerts.xapRedoLogSize
-
kapacitor.alerts.xapJvmAppFailed
-
kapacitor.alerts.xapJvmMemoryUsedPercent
-
kapacitor.alerts.xapJvmProcFailed
Example of usage above alerts with thier properties:
--set kapacitor.alerts.dihFlinkJobRunningState.enabled=true,kapacitor.alerts.dihFlinkJobCancellingState.enabled=false,kapacitor.alerts.xapRedoLogSize.enabled=false,kapacitor.alerts.dihFlinkJobRestartingState.enabled=false,kapacitor.alerts.dihFlinkJobManagerTaskSlots.value=2
There is also an option to provide custom alerts, defined in a separate configuration yaml file, in the following way:
--set-file kapacitor.customTicksConfig=/Users/john/dev/kapacitor/tick-config.yaml
Example of tick-config.yaml:
mydb1.tick: |
  dbrp "mydb"."one_week_policy"

  stream
      |from()
          .measurement('jvm_memory_heap_used-percent')
          .where(lambda: isPresent("pu This is the unit of packaging and deployment in the GigaSpaces Data Grid, and is essentially the main GigaSpaces service. The Processing Unit (PU) itself is typically deployed onto the Service Grid. When a Processing Unit is deployed, a Processing Unit instance is the actual runtime entity._instance_id"))
          .groupBy('pu_instance_id','pu_name','host','pid')
      |alert()
          .crit(lambda: "value" > 0)
          .stateChangesOnly(1d)
          .message('{{ index .Tags "host" }}  :: {{ index .Tags "pu_instance_id" }}  ')

cpu-alert.tick: |
  dbrp "mydb"."autogen"

  var alert_name = 'cpu-alert'

  stream
      |from()
          .measurement('os_cpu_used-percent')
      |alert()
          .crit(lambda: int("value") > 15)
          .stateChangesOnly(1d)
  		.message('{{ .Vars.alert_name }} on {{ index .Tags "host" }} - {{ .Level }} - {{ .Name }}')
  		.details('Process PPID={{ index .Tags "pid" }} on {{ index .Tags "host" }} use {{ index .Fields "value" }} CPU%')