Viewing Host Information
A host is discovered by having a Grid Service Agent running on it.
To view host information:
List all hosts
Command:
gs.{sh/bat} host list
Description:
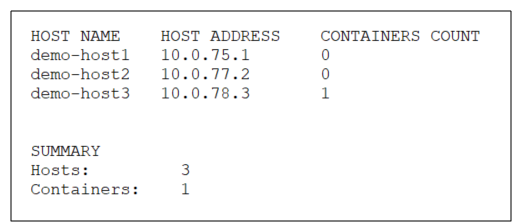
Lists all the host machines.
Input Example:
<GS_HOME>/bin/gs host list
<GS_HOME>/bin/gs.sh host list
Output Example:
Parameters and Options:
None
List containers per host
Command:
gs.{sh/bat} host info --containers <name>
Description:
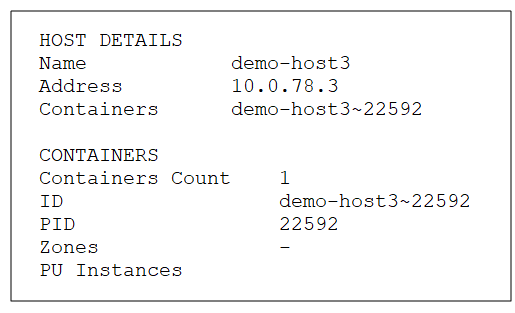
Lists all the containers on a specific host machine.
Input Example:
<GS_HOME>/bin/gs host info --containers localhost
<GS_HOME>/bin/gs.sh host info --containers localhost
Output Example:
Parameters and Options:
| Item | Name | Description |
|---|---|---|
| Parameter | name | Provide the name (or IP address) of the host for which you want to see the list of containers. |
List host operating system information
Command:
gs.{sh/bat} host info --os <name>
Description:
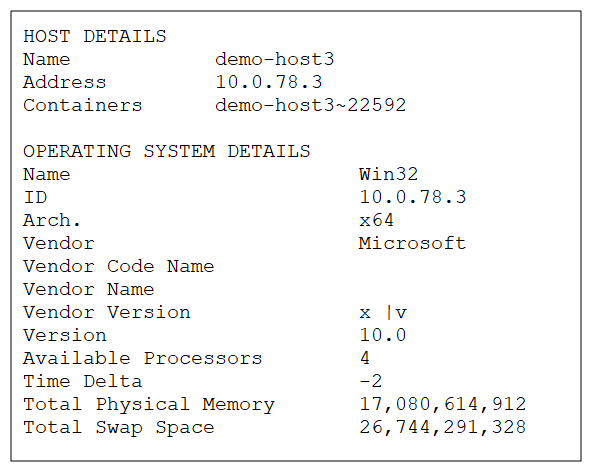
Lists all the operating system and related host machine details for a specific host machine, such as OS type, host architecture, OS version, etc.
Input Example:
<GS_HOME>/bin/gs host info --os localhost
<GS_HOME>/bin/gs.sh host info --os localhost
Output Example:
Parameters and Options:
| Item | Name | Description |
|---|---|---|
| Parameter | name | Name (or IP address) of the host for which you want to see the operating system information. |
List host operating system statistics
Command:
gs.{sh/bat} host info --os-stats <name>
Description:
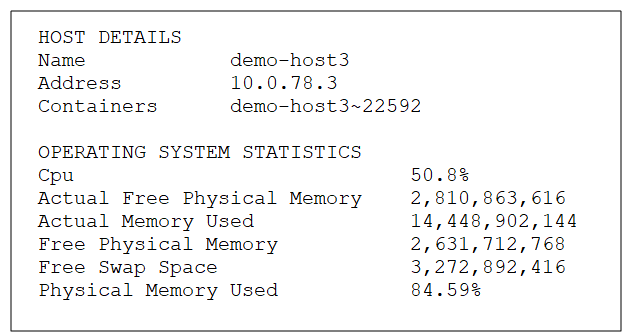
Lists several operating system statistics for a specific host machine, such as free physical memory, memory used, and free swap space.
Input Example:
<GS_HOME>/bin/gs host info --os-stats localhost
<GS_HOME>/bin/gs.sh host info --os-stats localhost
Output Example:
Parameters and Options:
| Item | Name | Description |
|---|---|---|
| Parameter | name | Name (or IP address) of the host for which you want to see the operating system statistics. |
List all hosts
Path
GET /hosts
Description:
This option lists the name, IP address, and containers for all the hosts in the service grid.
Example Request:
curl -X GET --header 'Accept: application/json' 'http://localhost:8090/v2/hosts'
Example Response:
[
  {
    "name": "admin",
    "address": "172.20.3.93",
    "containers": [
      "admin~13972"
    ]
  }
]
Options:
None.
View specific host
Path
GET /hosts{id}
Description:
This option lists the name, IP address, and containers for a specific host.
Example Request:
curl -X GET --header 'Accept: application/json' 'http://localhost:8090/v2/hosts/admin'
Example Response:
{
  "name": "admin",
  "address": "172.20.3.93",
  "containers": [
    "admin~13972"
  ]
}
Options:
| Option | Description | Required |
|---|---|---|
| host name | Provide the host name for which you want to see the general details. | Yes |
List containers per host
Path
GET /hosts{id}/containers
Description:
This option lists the Host ID, Process ID, zones, and Processing Unit![]() This is the unit of packaging and deployment in the GigaSpaces Data Grid, and is essentially the main GigaSpaces service. The Processing Unit (PU) itself is typically deployed onto the Service Grid. When a Processing Unit is deployed, a Processing Unit instance is the actual runtime entity. instances for containers on a specific host.
This is the unit of packaging and deployment in the GigaSpaces Data Grid, and is essentially the main GigaSpaces service. The Processing Unit (PU) itself is typically deployed onto the Service Grid. When a Processing Unit is deployed, a Processing Unit instance is the actual runtime entity. instances for containers on a specific host.
Example Request:
curl -X GET --header 'Accept: application/json' 'http://localhost:8090/v2/hosts/admin/containers'
Example Response:
[
  {
    "id": "admin~13972",
    "pid": 13972,
    "zones": [],
    "instances": [
      "alertSpace~1",
      "monitorSpace~1"
    ]
  }
]
Options:
| Option | Description | Required |
|---|---|---|
| host name | Provide the host name for which you want to see the container information. | Yes |
List host operating system information
Path
GET /hosts{id}/details/os
Description:
This option lists the container information for a specific host.
Example Request:
curl -X GET --header 'Accept: application/json' 'http://localhost:8090/v2/hosts/admin/details/os'
Example Response:
{
  "id": "172.20.3.93",
  "name": "Win32",
  "timeDelta": 0,
  "currentTimeInMillis": 1521375407792,
  "arch": "x64",
  "version": "6.3",
  "availableProcessors": 8,
  "totalSwapSpaceSizeInBytes": 45535817728,
  "totalPhysicalMemorySizeInBytes": 34261528576,
  "hostName": "admin",
  "hostAddress": "172.20.3.93",
  "vendor": "Microsoft",
  "vendorCodeName": "Vienna",
  "vendorName": "Windows 7",
  "vendorVersion": "7"
}
Options:
| Option | Description | Required |
|---|---|---|
| host name | Provide the host name for which you want to see the operating system information. | Yes |
List host operating system statistics
Path
GET /hosts{id}/statistcics/os
Description:
This option lists certain operating system statistics, such as free memory and used memory, for the specified host machine.
Example Request:
curl -X GET --header 'Accept: application/json' 'http://localhost:8090/v2/hosts/admin/statistics/os'
Example Response:
{
  "timestamp": 1521375496115,
  "adminTimestamp": 1521375496115,
  "freeSwapSpaceSizeInBytes": 28697755648,
  "freePhysicalMemorySizeInBytes": 19815034880,
  "actualFreePhysicalMemorySizeInBytes": 20070580224,
  "physicalMemoryUsedPerc": 42.165350748885395,
  "cpuPerc": 0.06905130613591937,
  "cpuPercFormatted": "6.9%",
  "actualMemoryUsed": 14446493696
}
Options:
| Option | Description | Required |
|---|---|---|
| host name | Provide the host name for which you want to see the operating system statistics. | Yes |
The Hosts view provides a general overview of the host machines, Processing Units, and Spaces, and relevant containers..
Container information is explained in the Viewing Container Information topic.
| Item | Description |
|---|---|
| Host | |
| Name | Name of the host machine. |
| CPU | Indicator of how much CPU is being used, in %. |
| Memory Utiliz. (GB) | Indicator of how much of the host memory is being used, in both GB and %. |
| Grid Services | List of service grid components that are up and running (Grid Service Agent and containers). |
| Processing Units | List of Processing Units that are deployed on the host (with the number of running instances). |
| Primaries & Backups | Number of running Processing Unit instances according to primary and backup status. |
| Grid Service Agent | |
| Name | Name of the Grid Service Agent. |
| CPU | Indicator of how much CPU is being used, in %. |
| Used Heap (MB) | Indicator of how much heap memory the Grid Service Agent is utilizing, in both MB and %. |
| Threads | How many threads the Grid Service Agent has open. |
| Space |
|
| Name | Name of the Space. |
| Type | Type of Space (stateful or stateless). |
| Space Instance | |
| Name | Name of the Space instance. For additional information about the Space instance, you can drill through to the Spaces view via the Actions menu. |
Additionally, you can view the following information from the Hosts tab in the Processing Units view:
| Item | Description |
|---|---|
| (status icon) | |
| OS | Icon that indicates which operating system is running on the host machine. |
| CPU | Indicator of how much CPU is being used, in %. |
| Memory (GB) | Indicator of how much of the host memory is being used, in both GB and %. |
| Core CPUs | Number of cores in the CPU. |
Refer to the Admin API topics in the Developer Guide.