SpaceDeck – Hosts
This menu allows you to view information about specific hosts. In addition, single or multiple logs can be generated. Hosts can be used to monitor the health of all your hosts to ensure that if limits are being reached, there is an opportunity to reorganize data or increase the amount of RAM or nodes.
Main Hosts Page
This is a view of the main hosts page:
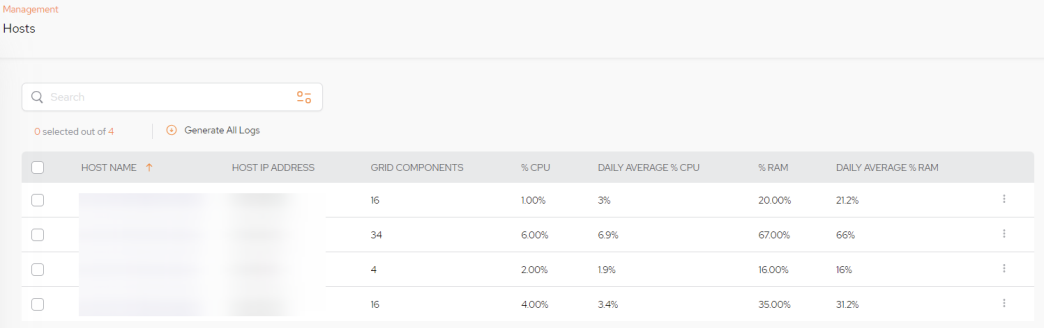
Hosts Fields
-
HOST NAME – The Kubernetes
 An open-source container orchestration system for automating software deployment, scaling, and management of containerized applications. host name in the machine.
 -
HOST IP ADDRESS – The Kubernetes node IP address.
-
GRID COMPONENTS – The number of pods related to this node.
-
%CPU – Refers to the percentage of a machine's CPU (Central Processing Unit
This is the unit of packaging and deployment in the GigaSpaces Data Grid, and is essentially the main GigaSpaces service. The Processing Unit (PU) itself is typically deployed onto the Service Grid. When a Processing Unit is deployed, a Processing Unit instance is the actual runtime entity.) that is being used at a given time. -
DAILY AVERAGE % CPU – Refers to the average percentage of a machine's CPU over a 24 hour period. Used to understand how much CPU is typical for a system over time.
-
%RAM – Refers to the percentage of a machine's RAM (Random Access Memory) that is being used at a given time.
-
DAILY AVERAGE % RAM – Refers to the average percentage of a machine's RAM over a 24 hour period. Used to understand how much RAM is typical for a system over time.
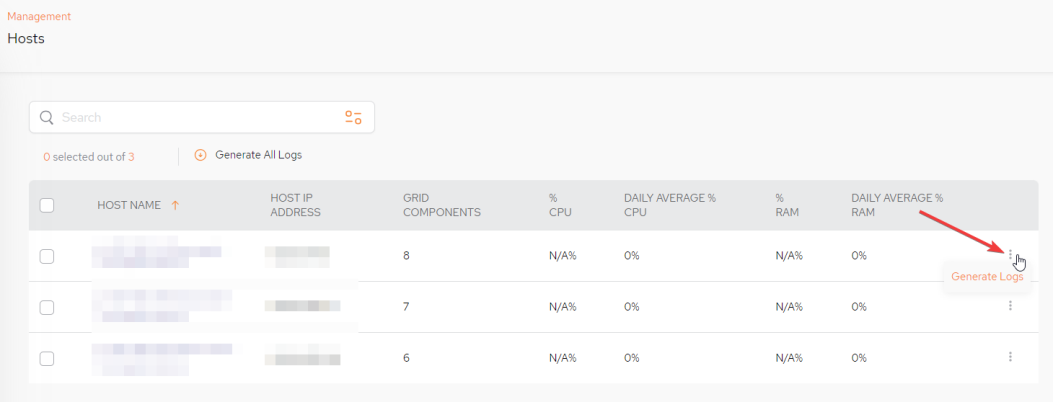
Generate Dumps
There is the ability to generate log dump files, that are saved locally, that include information about the runtime environment.
Log dumps can be generated in three different ways:
Log dump of a single host: Selecting a single host:
-
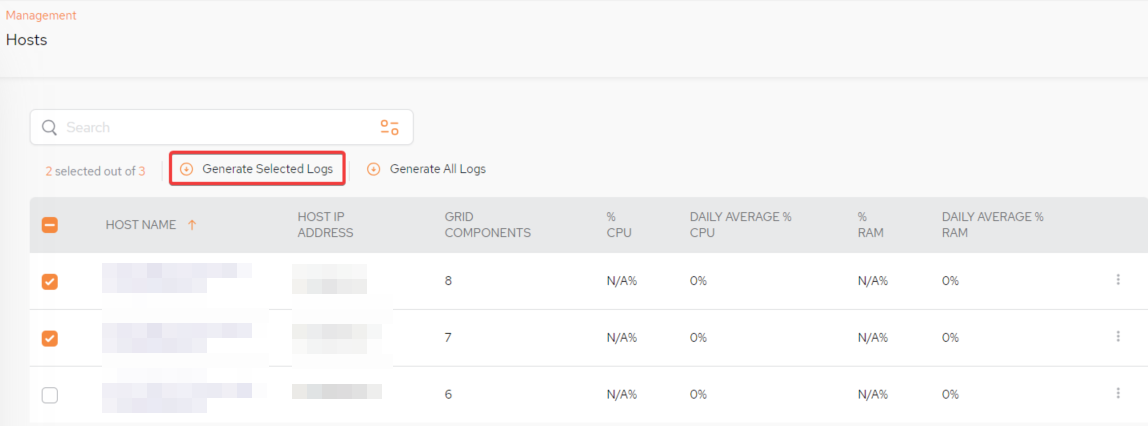
Log dump of selected hosts: Select more than one and clicking the Generate Selected Log situated above the table
-
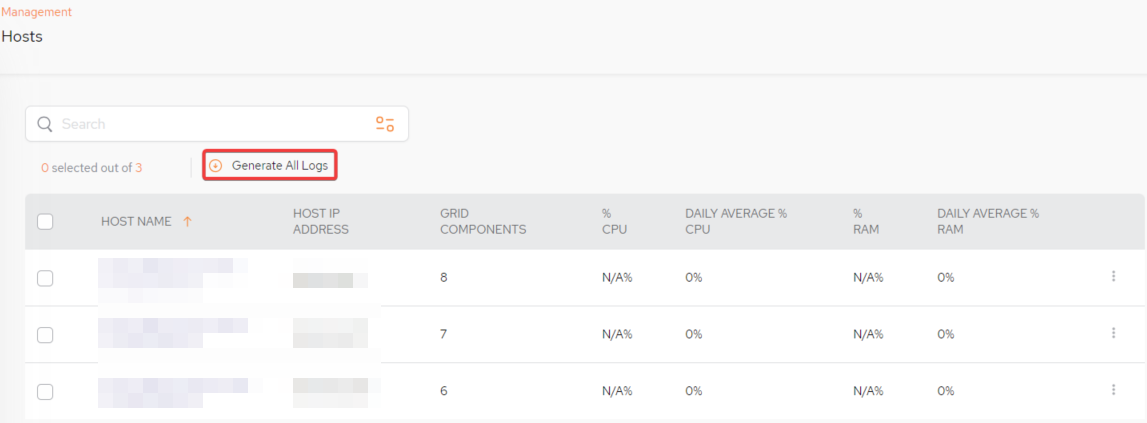
Log dump of all hosts: Clicking the Generate All Logs option situated above the table
Hosts Details
Click on a host name to view details of that host. Two tabs are available: System Information and Pods.
.
View Hosts Details - System Information Tab
The System Information tab displays information relating to the architecture of the machine. In addition the services running on this host are displayed, including heap used, percentage of CPU and number of threads:
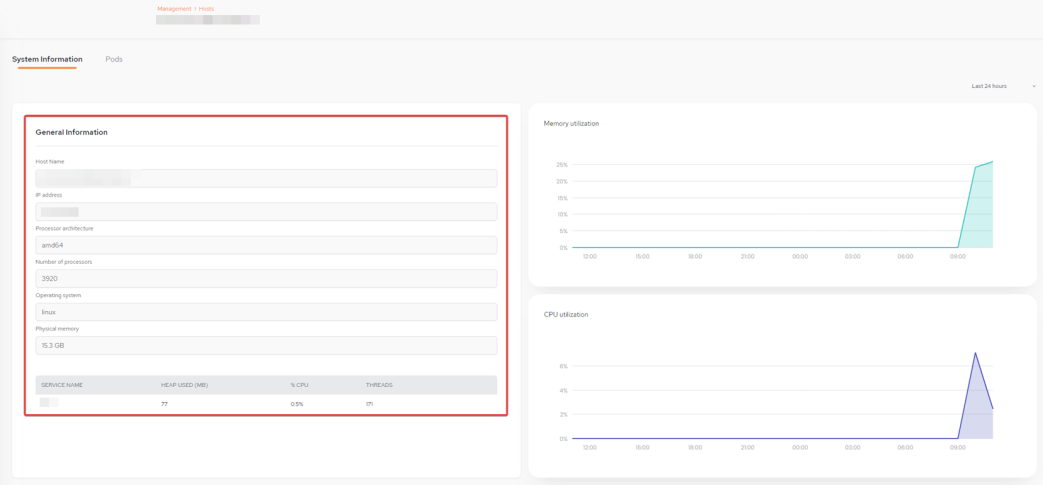
General Information Fields
-
Host Name - Name of the cluster.
-
IP address - IP address of the cluster.
-
Processor Architecture - Processor of the machine being used.
-
Number of Processors - Number of processors in the machine.
-
Operating System - Operating system of the K8s cluster.
-
Physical Memory - Physical memory of the cluster.
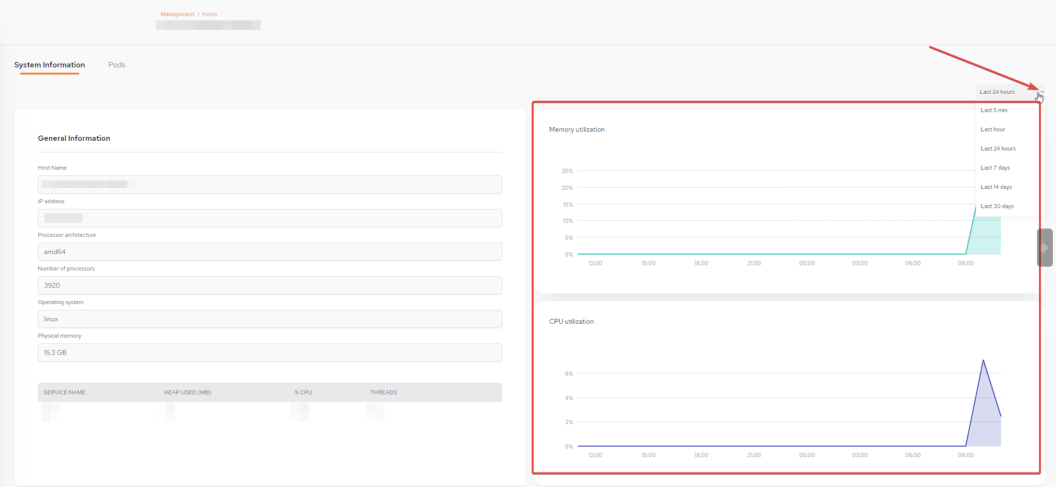
On the right side of the screen there are two metrics displayed: the memory and CPU utilization of this host. It is also possible to change the view of the time measure by selecting the time drop-down menu and selecting the appropriate choice:
View Hosts Details - Pods Tab
The Pods tab displays the Pods of the host.
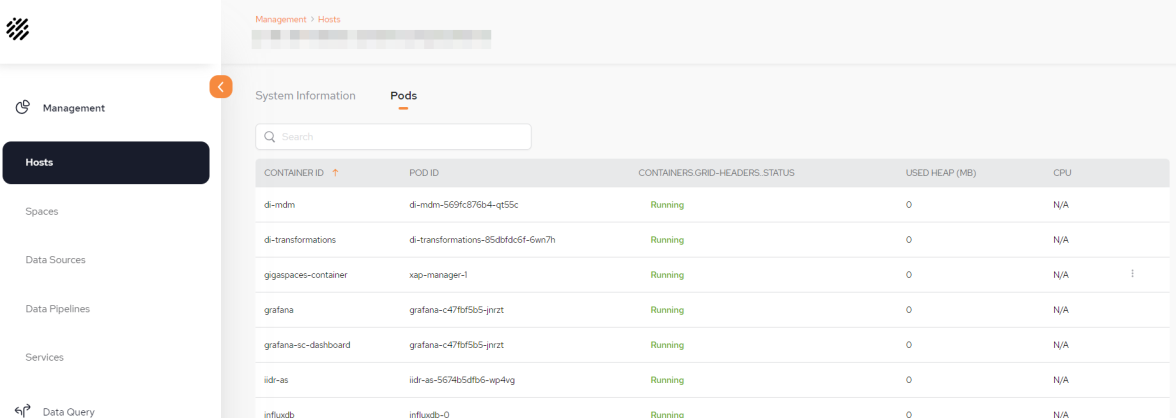
Pods Fields
-
CONTAINER ID – Identifier of the container.
-
POD ID – The POD ID in this container.
-
CONTAINERS.GRID-HEADERS.STATUS - This will display status of Running
-
USED HEAP (MB) – Refers to the heap used, in MB.
-
CPU – Refers to the percentage of a machine's CPU that the container is using.