 In-Memory Data Grid - achieve unparalleled speed, persistence, and accuracy.
Configuration
GigaSpaces provides a framework for collecting and reporting metrics from the distributed runtime environment into a metric repository of your choice, which can then be analysed and used to identify trends in the system behavior. Before you can start using the metrics framework you will need to first setup and configure your metric framework to work with GigaSpaces. GigaSpaces reports metrics using the Micrometer API, a framework that supports Open Telemetry and can be plugged in.
Overview
A Metric is a piece of code which provides a value of something at the current time (e.g. CPU percentage, free memory, active LRMI threads, etc.). GigaSpaces is bundled with an abundance of metrics which can be used to monitor its behaviour, and additional metrics can be defined by the user.
There are several frameworks that integrate out of the box with GigaSpaces:
- InfluxDB
- OTLP (generic, since 17.2.2)
- File reporter (for development time testing)
Configuration
By default, Metrics configuration is loaded from $GS_HOME/config/metrics/metrics.properties. This location can be overridden using the com.gigaspaces.metrics.config system property, which also supports URL.
For example, setting multiple destinations for metrics to include all out-of-the-box integrations:
# Multiple destinations
					metrics.registries=influxdb,file
					metrics.influxdb.uri=http://localhost:8086
					metrics.influxdb.db=xap_metrics
					metrics.influxdb.step=10
					metrics.file.path=/var/log/xap/metrics.log
			metrics.file.step=1
Plug in Other Frameworks
OTLP Provider
Since version 17.2.2, an OTLP generic provider is available out of the box, requiring no additional code. In metrics.properties, define the following:
metrics.registries=otlp
# Protocol: http or grpc
metrics.otlp.protocol=http
# OTLP Collector endpoint
metrics.otlp.url=
# Export interval in seconds
metrics.otlp.step=10
A direct registry implementation is also available for use as a plugin.
Custom Plugin
As an example, the following shows how to use Datadog. XAP GigaSpaces eXtreme Application Platform.
Provides a powerful solution for data processing, launching, and running digital services's
GigaSpaces eXtreme Application Platform.
Provides a powerful solution for data processing, launching, and running digital services's MicrometerRegistryBuilder uses ServiceLoader to discover GsMeterRegistryProvider implementations at startup. When metrics.registries=xyz is set, it:
- Scans all JARs in
$GS_HOME/lib/optional/metrics/forMETA-INF/services/com.gigaspaces.metrics.micrometer.GsMeterRegistryProvider - Finds
DatadogRegistryProvider, callsgetName()which matchesxyz - Calls
create(config)passing all properties frommetrics.propertiesas aPropertiesobject - The returned
DatadogMeterRegistryis registered as the active backend
In the example above, xyz can stand for datadog, dynatrace, or any other Open Telemetry framework.
Comparison with Built-in Backends
| Backend | How to Activate |
|---|---|
| InfluxDB | Built in — just set metrics.registries=influxdb and add required properties |
| OTLP (Generic) | Built in since 17.2.2 — set metrics.registries=otlp and configure metrics.otlp.* properties. No code required. |
| Datadog / Graphite / New Relic / Wavefront / … | Plugin JAR — drop in lib/optional/metrics and set in metrics.properties |
Code Example: Datadog Implementation
Project structure:
datadog-metrics-provider/
					├── pom.xml
					├── README.md
					└── src/main/
					├── java/com/gigaspaces/example/metrics/datadog/
					│   └── DatadogRegistryProvider.java
					└── resources/META-INF/services/
			└── com.gigaspaces.metrics.micrometer.GsMeterRegistryProvider
/**
* Pluggable Datadog metrics backend for GigaSpaces XAP.
*
* Implements GsMeterRegistryProvider so that XAP discovers this class
* via ServiceLoader and activates it when metrics.registries=datadog is set
* in config/metrics/metrics.properties.
*
* Supported properties in metrics.properties:
* metrics.registries=datadog
* metrics.datadog.apiKey=<your-api-key> # required
* metrics.datadog.applicationKey=<your-app-key> # optional
* metrics.datadog.uri=https://api.datadoghq.com # optional, default shown
* metrics.datadog.step=10 # optional, seconds (default: 10)
*/
public class DatadogRegistryProvider implements GsMeterRegistryProvider {
@Override
public String getName() {
return "datadog";
}
@Override
public MeterRegistry create(Properties config) {
DatadogConfig datadogConfig = new DatadogConfig() {
@Override
public String apiKey() {
String key = config.getProperty("metrics.datadog.apiKey");
if (key == null || key.isBlank()) {
throw new IllegalStateException(
"metrics.datadog.apiKey is required but not set in metrics.properties");
}
return key;
}
@Override
public String applicationKey() {
return config.getProperty("metrics.datadog.applicationKey", "");
}
@Override
public String uri() {
return config.getProperty("metrics.datadog.uri", "https://api.datadoghq.com");
}
@Override
public Duration step() {
String stepSeconds = config.getProperty("metrics.datadog.step");
if (stepSeconds != null && !stepSeconds.isBlank()) {
try {
return Duration.ofSeconds(Long.parseLong(stepSeconds));
} catch (NumberFormatException ignored) {
}
}
return Duration.ofSeconds(10);
}
@Override
public String get(String key) {
return config.getProperty("metrics.datadog." + key);
}
};
return DatadogMeterRegistry.builder(datadogConfig)
.clock(Clock.SYSTEM)
.build();
}
}The resource file com.gigaspaces.metrics.micrometer.GsMeterRegistryProvider should contain:
com.gigaspaces.example.metrics.datadog.DatadogRegistryProviderMetric Providers
Each user implements his own metric framework.
OTLP has an interface to report metrics but no standard for retrieving them to allow easy integrations with application’s automations & UI.
To address this issue, a single, simple API was added: ask for a metric by name (e.g. "active connections"). The user can pick a time window and choose which backend should answer — the built-in one, or another one plugged in later. New backends can be added on the fly (hot-plug), without restarting anything.
API:
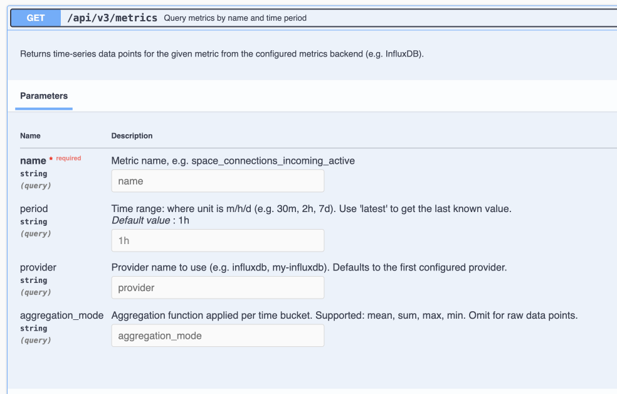
Generic response body:
[
  { "timestamp": "2026-07-16T09:00:00Z", "value": 42.0 },
  { "timestamp": "2026-07-16T09:05:00Z", "value": 47.5 }
]
What should be implemented to support the above api?
-
Implement the following interface:
public interface GsMetricsQueryProvider { /*** Unique name identifying this provider, e.g. "influxdb", "datadog", "dynatrace".Used to select a specific provider via {@code metrics.query.provider} property.*/ String getName(); /*** Returns true if the required configuration (URL, credentials, etc.) is present.Used for auto-detection when no explicit provider is configured.*/ boolean isConfigured(); /*** Query metric data points for the given metric name and time range. * @param metricName the metric name (e.g "space_connections_incoming_active") * @param from start of the time range (inclusive) * @param to end of the time range (inclusive) * @param aggregationMode aggregation function to apply per time bucket: "mean", "sum", "max", "min". * Null or blank means raw data points with no aggregation. * @return list of data points ordered by timestamp, never null */ List<MetricDataPoint> query(String metricName, Instant from, Instant to, String aggregationMode); /** * Returns the last known value for the given metric, regardless of when it was reported. * Each provider must implement this using their backend's native "last value" API. * * @param metricName the metric name * @return single-element list with the last known data point, or empty if no data found */ List<MetricDataPoint> queryLatest(String metricName); } -
Upload query metric provider jar using Rest API
REpresentational State Transfer. Application Programming Interface
An API, or application programming interface, is a set of rules that define how applications or devices can connect to and communicate with each other. A REST API is an API that conforms to the design principles of the REST, or representational state transfer architectural style. , Or add the jar to$GS_HOME/lib/optional/metrics/
