Statistics View
The Statistics view provides information on operation statistics in the Space![]() Where GigaSpaces data is stored. It is the logical cache that holds data objects in memory and might also hold them in layered in tiering. Data is hosted from multiple SoRs, consolidated as a unified data model., such as read, write, take, etc. If you have a system with MemoryXtend
Where GigaSpaces data is stored. It is the logical cache that holds data objects in memory and might also hold them in layered in tiering. Data is hosted from multiple SoRs, consolidated as a unified data model., such as read, write, take, etc. If you have a system with MemoryXtend![]() Related to Data Tiering. The MemoryXtend (blobstore) storage model allows an external storage medium (one that does not reside on the JVM heap) to store the GigaSpaces Space data and is designed for operational workloads. It keeps all indexes in RAM for better performance., you can also see statistics for the off-heap driver and the disk storage (RocksDB) driver.
Related to Data Tiering. The MemoryXtend (blobstore) storage model allows an external storage medium (one that does not reside on the JVM heap) to store the GigaSpaces Space data and is designed for operational workloads. It keeps all indexes in RAM for better performance., you can also see statistics for the off-heap driver and the disk storage (RocksDB) driver.
Operations Statistics
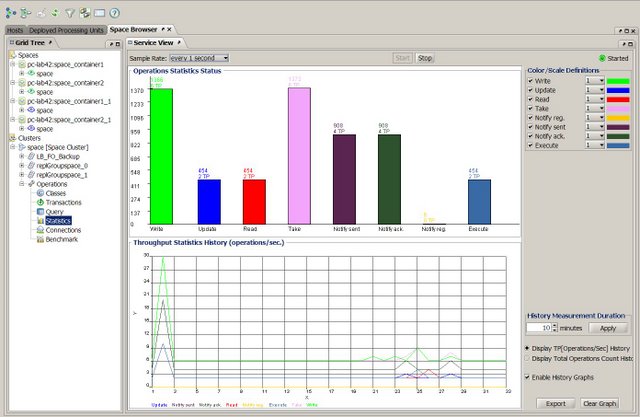
The Operations tab provides a graphical representation of Space operations performed and average throughput.

Operations Statistics Status Area
The graph in the upper area of the tab displays the total number of operations performed in the Space. The legend on the right side shows the color that represents each operation in the graph. You can select and clear the check boxes as necessary to show or hide data for the different operations in the graph.
Throughput Statistics History Area
The graph in the lower area of the tab display the following information, depending on the selected option:
- Display TP (Operations/Sec) History - displays the current throughput performance (operations per second).
- Display Total Operations Count History - displays the history of the Space operations, namely the number of operations performed since you began working with the Space.
Use the following options to modify the view behavior:
- History Measurement Duration - configure how much history to display in the view and click Apply.
- Enable History Graphs - clear this check box to stop displaying current statistics in the view.
- Export - click to export the operation statistics in a Microsoft Excel file.
- Clear Graph – click to clear the graph.
MemoryXtend Statistics
The MemoryXtend tab is only visible if you have MemoryXtend in your system. The tab displays cache statistics for the off-heap storage.

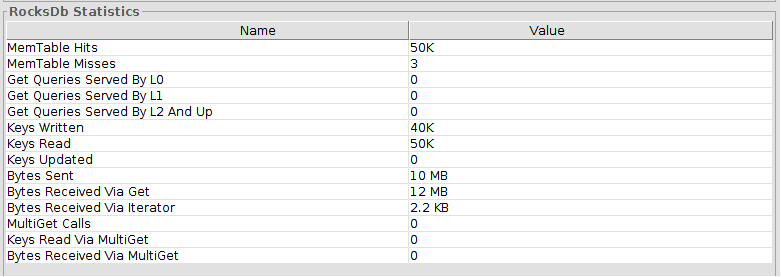
If you have the disk storage driver configured, you can also view the blobstore (RocksDB) statistics.

Refresh Options
You can choose to refresh the statistics display periodically. When auto refresh is running, a green blinking dot is displayed on the right side of the screen. Select the desired refresh rate from the drop-down menu. To stop the statistics automatic refresh, click Stop.

Auto-refresh activity impacts server performance, so you might want to stop it when running benchmarks.
 In-Memory Data Grid - achieve unparalleled speed, persistence, and accuracy.