On Demand Object Analysis
On Demand Object Analysis shows the real-time memory footprint of an GigaSpaces Space![]() Where GigaSpaces data is stored. It is the logical cache that holds data objects in memory and might also hold them in layered in tiering. Data is hosted from multiple SoRs, consolidated as a unified data model. Object.
Where GigaSpaces data is stored. It is the logical cache that holds data objects in memory and might also hold them in layered in tiering. Data is hosted from multiple SoRs, consolidated as a unified data model. Object.
What Aspects of a Space Object are we Analyzing?
GigaSpaces enables developers to store and manage data within a Space Object.
The Space Object contains one or more Object Types, comparable to tables within a database. Object data is stored in memory, and optionally on disk, as configured by the system administrator.
Based on the properties of each Object Type, and the number of occurrences of each property, On Demand Object Analysis calculates the amount of memory stored within a Space Object. In addition, it calculates the memory footprint of the object indexes.
This process is done after the initial provisioning and load of sample data, and is on-going while new services are deployed and additional data is stored within the space.
One use of On Demand Object Analysis is by developers when deploying new services, to determine memory usage. It can be done in a separated staging environment or as part of the initial data load.
Administrators can use object analysis on a daily or weekly basis, to analyze system health and to determine the memory usage for the entire Space Object or for specific object types. It is possible to analyze the data size at the partition level, to identify cases where a specific partition is overloaded with data that could potentially impact its performance.
Although Object Analysis results are a close approximation of memory usage, some variations may exist between the reported results and the exact amount of memory used.
How Do I Perform an Object Analysis?
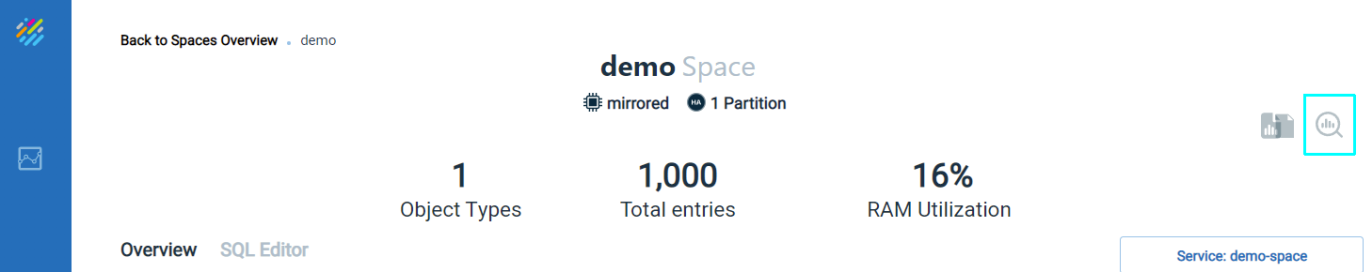
Trigger an Object Analysis by pressing the Run Objects Analysis icon on the Ops Manager Analysis screen:
A dialog box will display, asking for a confirmation of the analysis request:
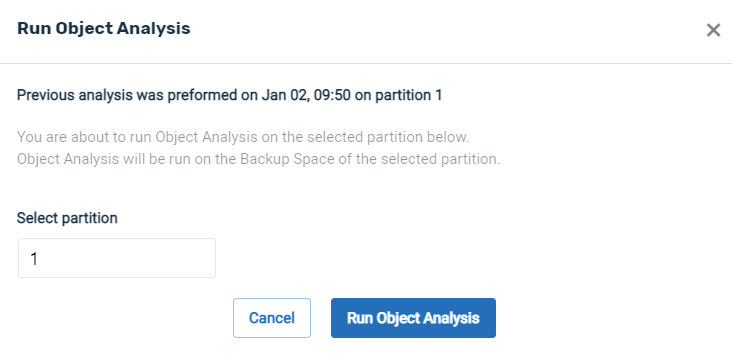
A default partition is indicated for the analysis, which you may change if desired.
Because the Object Analysis process can take some time, a confirmation screen asks if you want to continue:
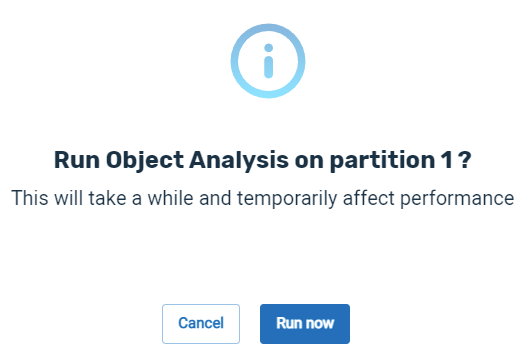
Press Run now to confirm that you wish to begin the analysis.
By default, the system will use the path GS_HOME/config/ui/heapReports to temporarily keep the report. This path can be configured by setting the system parameter com.gs.heap-report.path.
Because the Object analysis process may consume considerable system resources, it is recommended to run the analysis at an off-peak time, when the system is experiencing relatively low usage.
During the analysis process, the screen appears as follows:

Results of Object Analysis
The result of the Object Analysis is two-fold:
- The Object Analysis Report is generated.
- The Space and Object screens have additional information.
1. Object Analysis Report
When the analysis is complete, a message will appear as follows:

Press Show object analysis report to view the memory usage report.
Alternatively, you can click the icon next to the Report icon to see the report:
![]()
If the Object analysis is not successful, press Review Logs to determine the cause of the failure.
Contents of the Object Analysis Report
The report appears as follows:
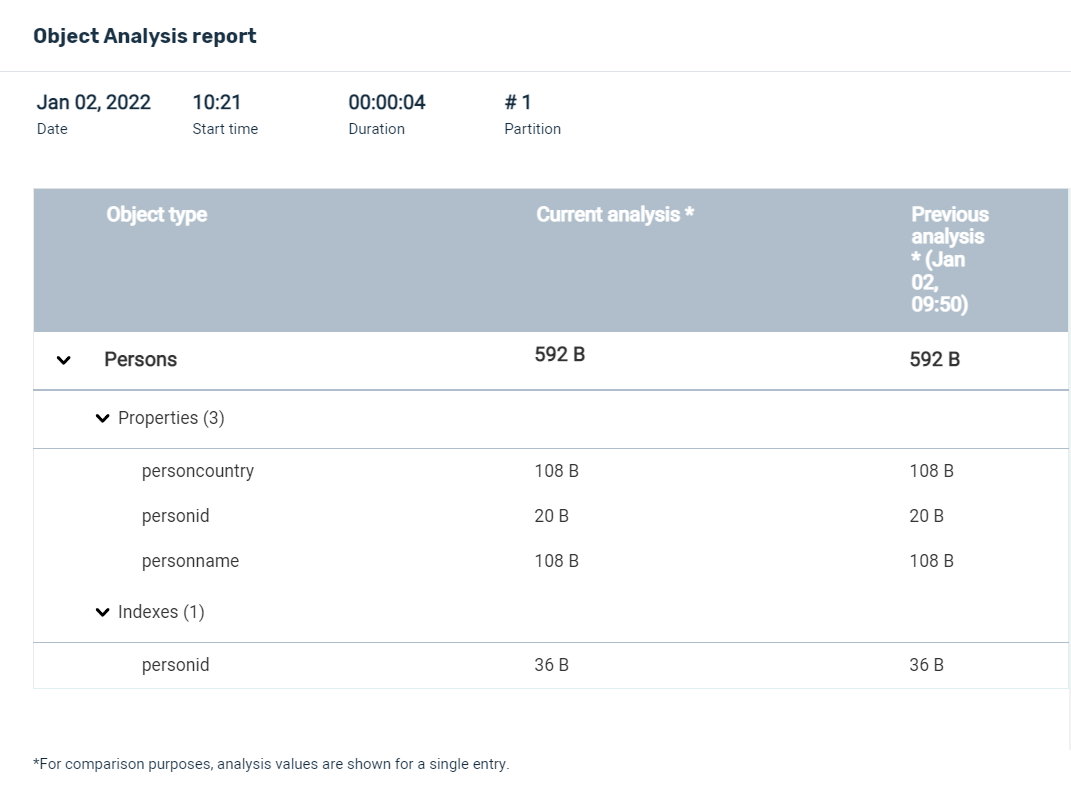
Notes on Indexes Analysis
Indexes are stored within the Space and used for fast access to data stored either in memory or on disk. This means that indexes compete with object type data for partition memory resources.
This is why it is important to analyze index sizes and take them into consideration as part of system monitoring and future planning.
Index sizes are calculated as part of the object analysis, and the calculated sizes can be seen within the object types reports. Each object type contains its indexes and their calculated sizes, including the ability to compare with the previous object analysis.
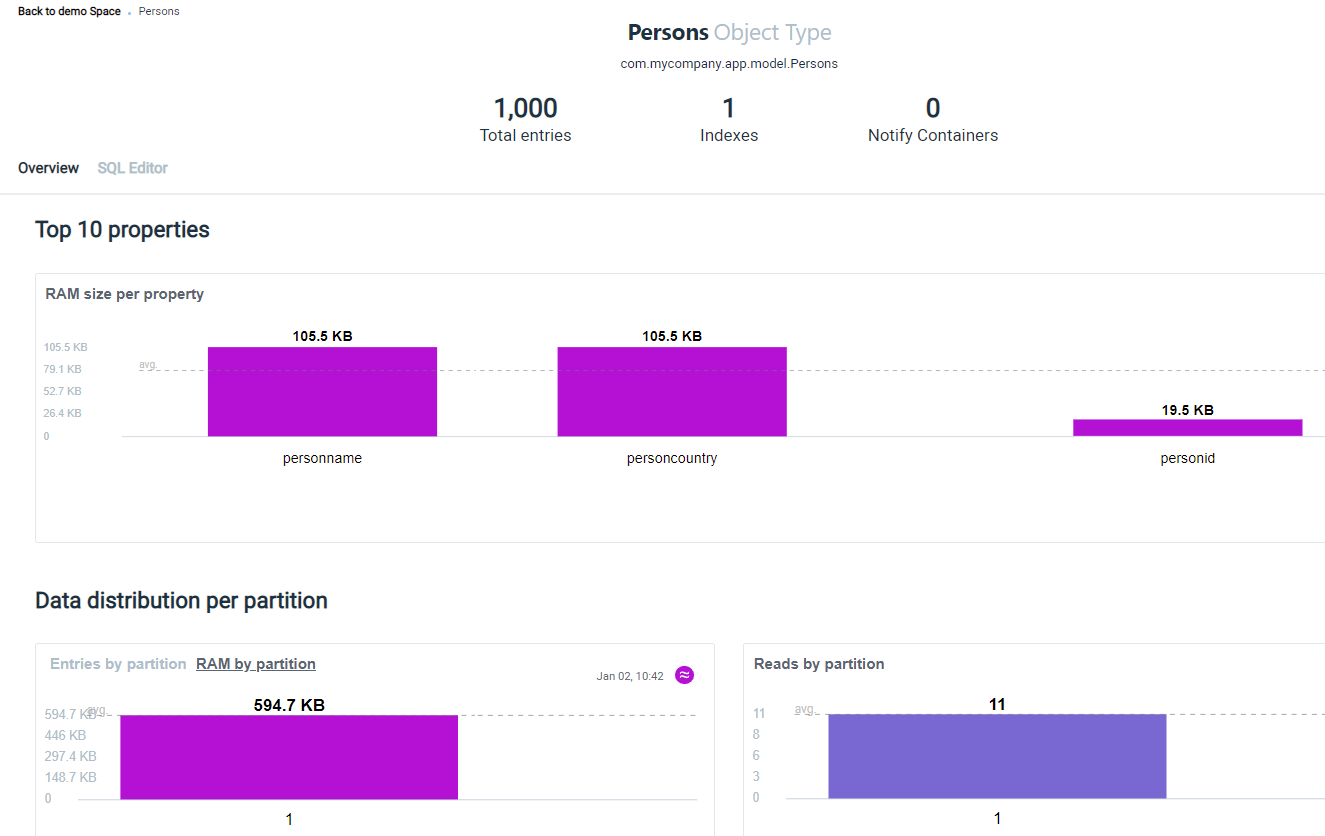
List of Object Types
If you scroll down the Space screen, you will see a list of Object Types:
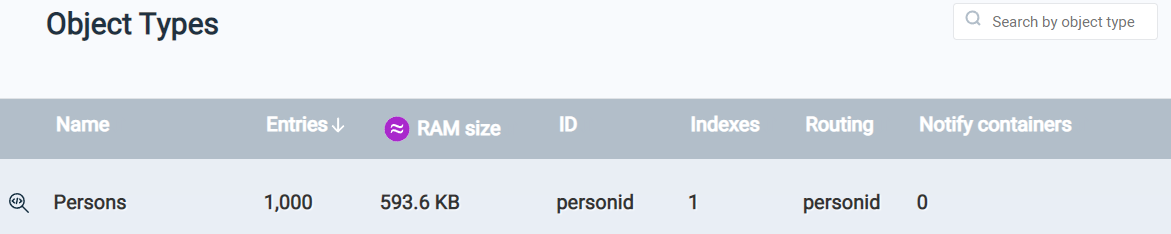
Note that the average RAM size is shown for each object.
Click on the Object name (Persons in this example) to see its Object Analysis data.