Distributed Tracing
This topic describes how to leverage Distributed Tracing in your GigaSpaces cluster to identify latency issues.
Overview
Distributed tracing is quickly becoming a must-have component in the tools that organizations use to monitor their complex, microservice-based architectures. This helps engineers to pinpoint errors and identify performance bottlenecks.
GigaSpaces monitoring, part of the GigaOps Stack, includes Zipkin, a distributed tracing system that gathers timing data to enable troubleshooting latency issues in the system. This enables more effective performance tuning.
For more information, view
Tracing with GigaSpaces
Proxy-Side Tracing
GigaSpaces allows its users to trace their code by using
In order to turn tracing on, you must configure a Tracer and register it with the GlobalOpenTelemetry.getTracer
Every synchronous method in the GigaSpaces API will add a span to the active span if it exists. When the span is finished it is reported to the tracing endpoint (e.g. Zipkin).
@Autowired
					GigaSpace gigaSpace;
					Tracer tracer = GlobalOpenTelemetry.getTracer("com.myapp");
					Span span = tracer.spanBuilder("process-order").startSpan();
					try (Scope scope = span.makeCurrent()) {
					// All GigaSpace calls inside this scope are automatically traced
					Order order = gigaSpace.readById(Order.class, orderId);
					order.setStatus(OrderStatus.PROCESSED);
					gigaSpace.write(order);
					} catch (Exception e) {
					span.setStatus(StatusCode.ERROR, e.toString());
					span.recordException(e);
					throw e;
					} finally {
					span.end();
					}
Zipkin Built-In Tracer
GigaSpaces provides a built-in bean com.gigaspaces.tracing.ZipkinTracerBean that can be used to send the traces to Zipkin as the tracing endpoint. This bean will register a GlobalTracer that can be used by the user's code. Same GlobalTracer will be used in the GigaSpaces proxy for the synchronous methods.
@Bean
				public ZipkinTracerBean tracerBean() {
				return new ZipkinTracerBean("GatewayService")
				.setZipkinUrl("http://zipkin.company.com")
				.setStartActive(true);
				}
Spring bean (recommended):
<bean id="zipkinTracer" class="com.gigaspaces.tracing.ZipkinTracerBean"
					init-method="start" destroy-method="destroy">
					<!-- Required: logical name that identifies this service in Zipkin UI -->
					<constructor-arg value="my-service"/>
					<!-- Optional: Zipkin base URL. Default: http://zipkin.service.consul:9411 -->
					<property name="zipkinUrl" value="http://zipkin-host:9411"/>
					<!-- Set to true to export spans (false = noop, no network traffic) -->
					<property name="startActive" value="true"/>
					</bean>
This bean is part of the xap-reporter module. To use it you need to add it to your processing unit![]() This is the unit of packaging and deployment in the GigaSpaces Data Grid, and is essentially the main GigaSpaces service. The Processing Unit (PU) itself is typically deployed onto the Service Grid. When a Processing Unit is deployed, a Processing Unit instance is the actual runtime entity. jar file with its dependencies.
This is the unit of packaging and deployment in the GigaSpaces Data Grid, and is essentially the main GigaSpaces service. The Processing Unit (PU) itself is typically deployed onto the Service Grid. When a Processing Unit is deployed, a Processing Unit instance is the actual runtime entity. jar file with its dependencies.
<dependency>
<groupId>org.gigaspaces</groupId>
<artifactId>xap-reporter</artifactId>
<version>17.2.0 </version>
</dependency>
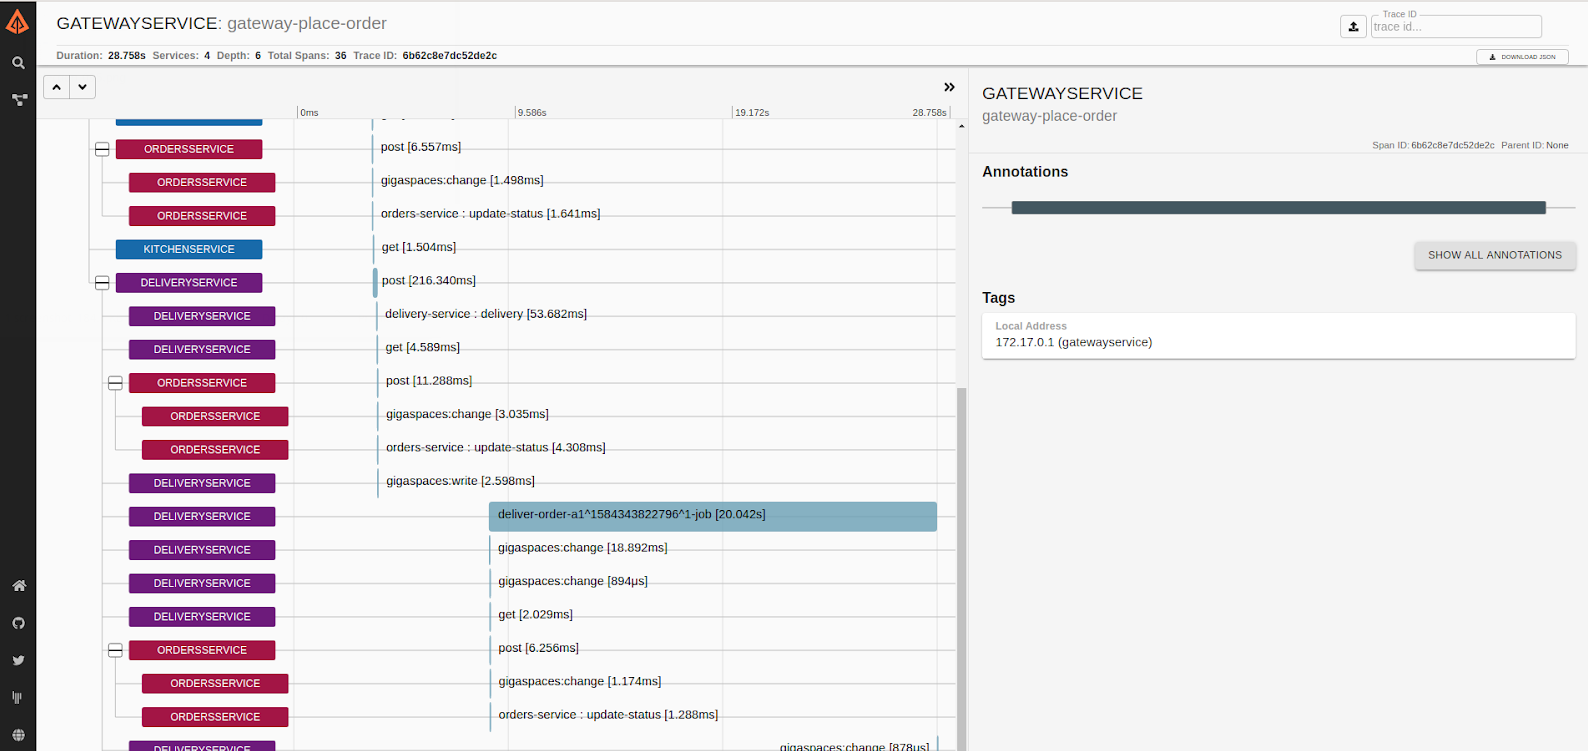
The screenshot below shows a "trace" of data sampled by Zipkin of multiple microservices running on a GigaSpaces distributed cluster: