GigaSpaces Ops Manager
The GigaSpaces Ops Manager is an enterprise-grade management platform that can be implemented for GigaSpaces-based applications across on-premise, cloud, and Kubernetes environments. Ops Manager is a robust web interface that provides visibility and real-time information about your GigaSpaces clusters and their services. It enables you to better monitor your clusters, and perform troubleshooting activities by analyzing various performance metrics, and reviewing alerts with defined thresholds. You can drill down to the partition level and create dump files, to review service log files for root-cause analysis.
In addition to real-time monitoring and troubleshooting capabilities, Ops Manager enables you to review and analyze data that resides within the cluster. Use Ops Manager to review Space-related information, such as object types and properties, and execute various queries as part of data discovery.
Accessing Ops Manager
The Ops Manager is deployed along with the Manager and the REST Manager API, and uses the same entry point. In order to open Ops Manager in your browser and view your GigaSpaces environment, you need to access the Manager's IP address on port 8090, or use localhost if your environment is deployed on a local agent.
If you had a previous version of GigaSpaces, when you used the Manager IP address and port in the URL field of your browser to access the REST Manager API (http://<MANAGER_IP>:8090/), you were automatically redirected to http://<MANAGER_IP>:8090/v2. This information may be stored in your browser cache and prevent you from opening Ops Manager. If this occurs, clear your browser cache to enable access to Ops Manager. If you want to open the REST Manager API, use the http://<MANAGER_IP>:8090/v2 URL.
If you aren't familiar with general GigaSpaces terminology, see the General Terms and Concepts topic in the Product Overview.
Understanding the Ops Manager Interface
Services
A service in the Ops Manager may represent a GigaSpaces Processing Unit, or external services and applications such as Spark or remote/web applications. The following services are supported.
| Icon | Name | Description |
|---|---|---|
|
|
Stateless | Contains one or more microservices. This kind of service may act like a client that interacts with other services. |
|
|
Stateful | Contains data in a Space instance. A set of stateful services comprise a GigaSpaces data grid. |
|
|
Mirror | A mirror service is stateless and provides asynchronous persistence to ensure that data isn't lost. The mirror acts as a dispatcher, pushing all primary Space partition changes to the database (or any other data storage solution). |
|
|
Web | Allows deploying web applications using packaged or exploded WAR files. |
|
|
WAN gateway | Replicates services between different clusters for disaster recovery planning and data locality. |
In addition to the main services, you can also deploy the following service sub-type.
| Name | Description |
|---|---|
| MemoryXtend | Service that has been configured for MemoryXtend, and can separate the data in the Space between hot storage (RAM) and warm/cold storage (off-heap RAM or SSD). |
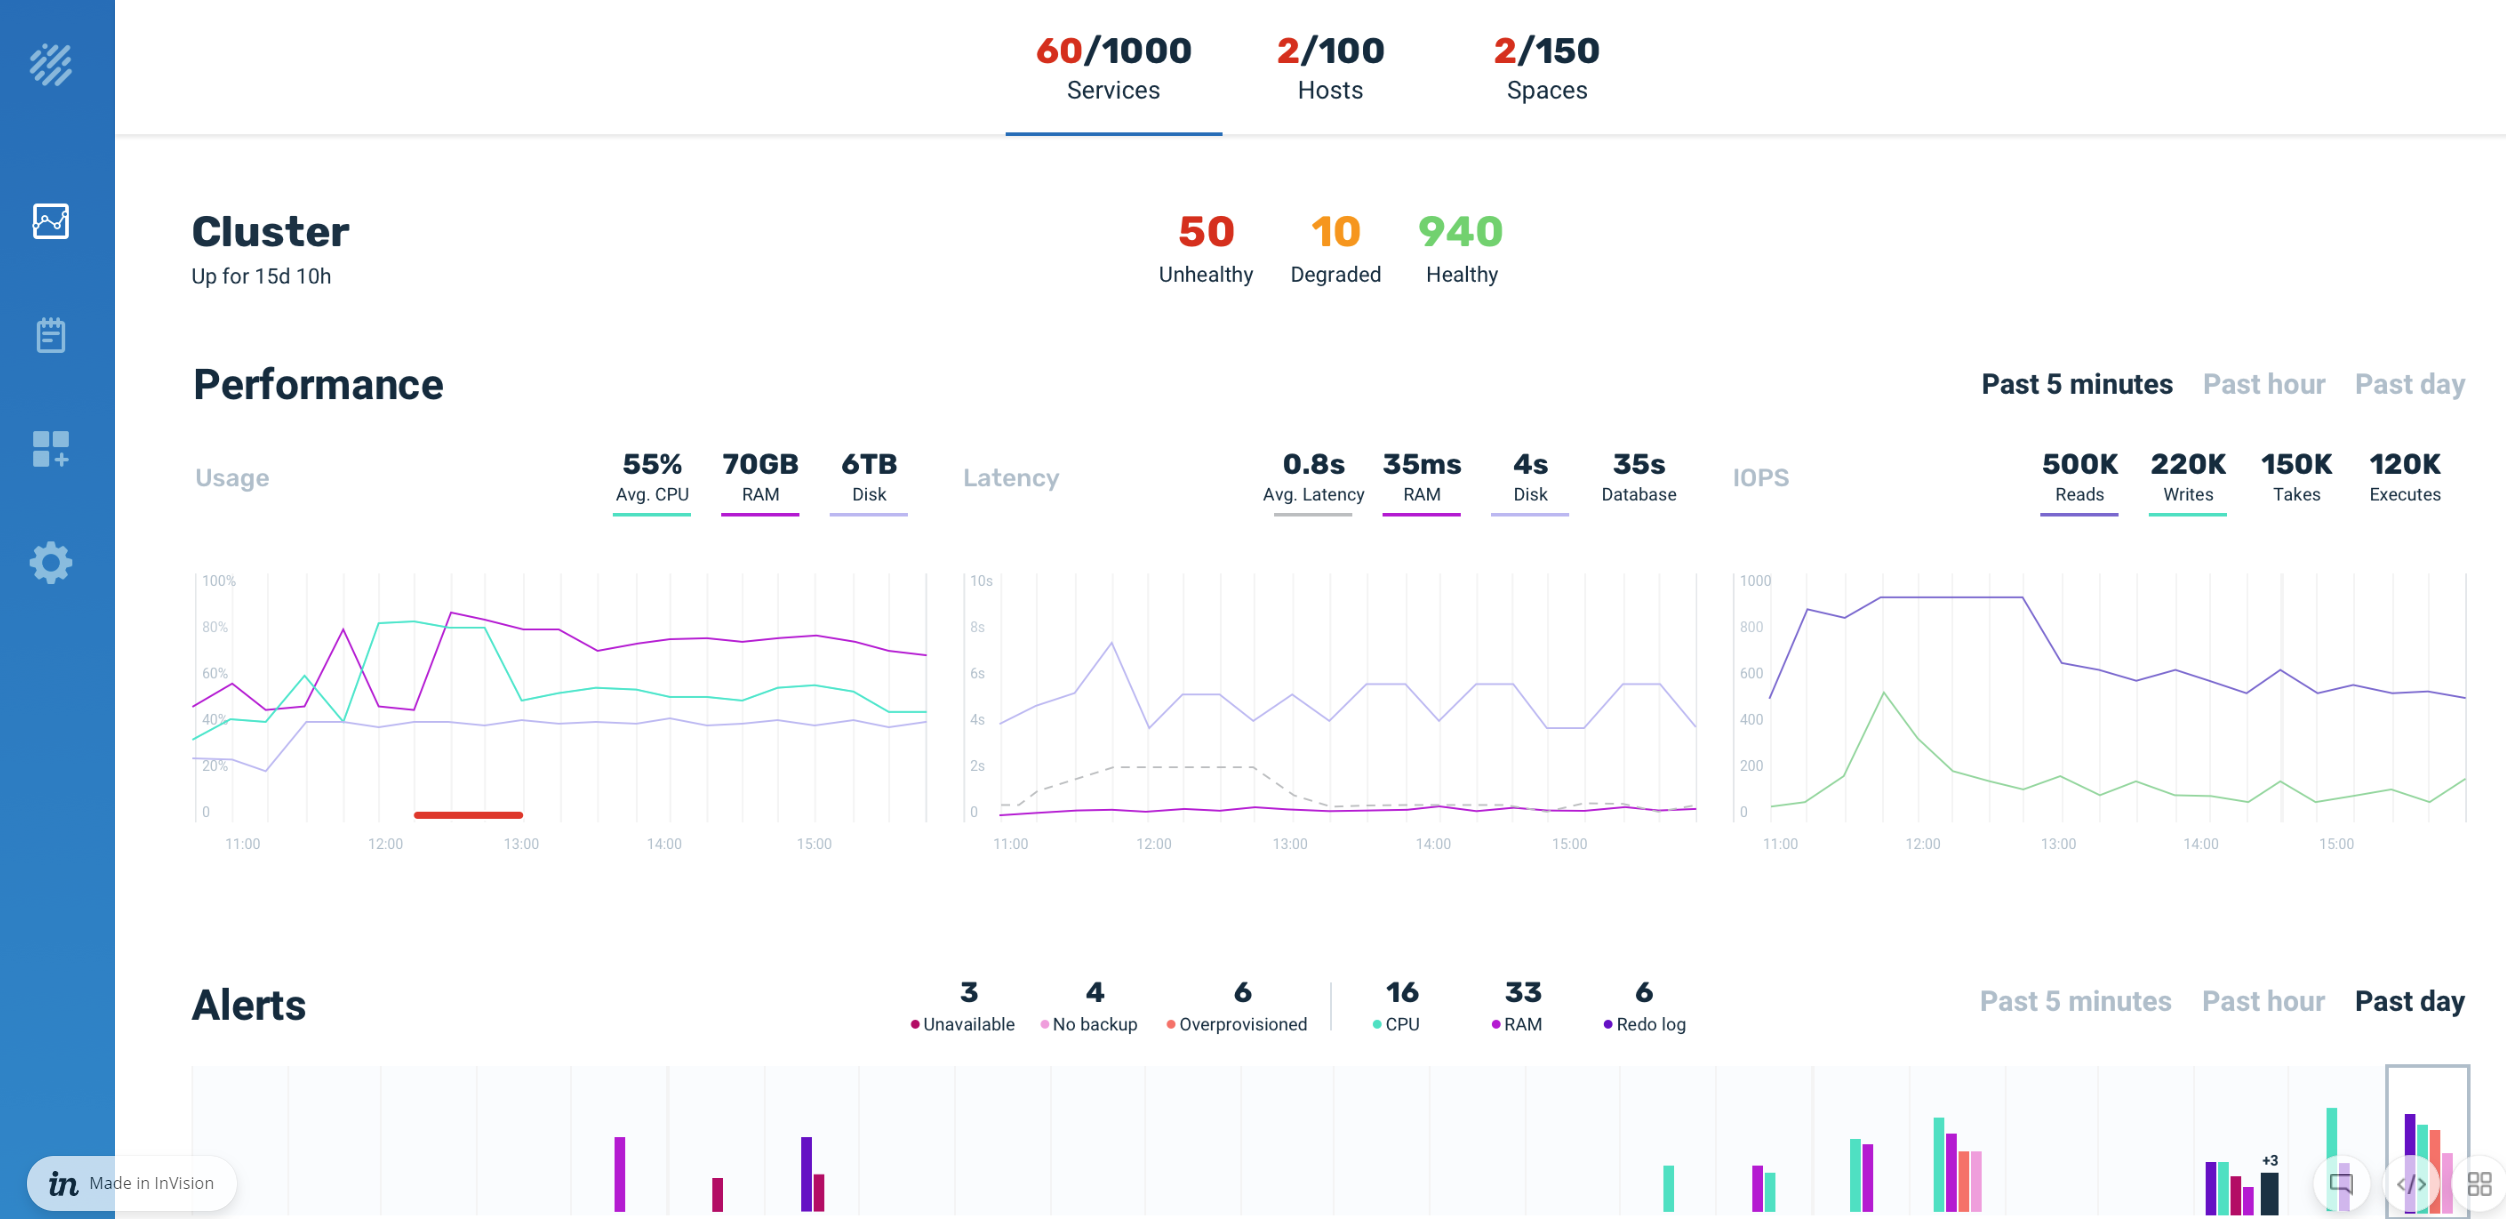
Cluster Metrics
Ops Manager includes graphs that display the following information:
- CPU usage - view the average CPU utilization as a percentage. This metric is available at the cluster level, and at the service level.
- IOPS - View the implemented IOPS types (such as reads, writes, takes, executes, etc. per second at the cluster level, and at the service level.
Ops Manager metrics can be ported to InfluxDB or other time series databases, so that you can use external monitoring and visualization tools (such as Grafana) to perform additional analysis.
Service Overview
The service overview shows a summary of all services vs. unhealthy services. You can also view the services sorted by health and severity. Additionally, you can apply filters by service type and RAM utilization, or search for specific services by name. Click a service to drill through to see the individual performance metrics and alerts for that service. For deeper analysis, you can create a dump file of the service logs via the download button in the upper right-hand corner.
In addition to reviewing the performance of individual services, you can drill down to the partition and instance level to review metrics such as CPU usage and memory consumption per specific instance.

