Data Visualization with Grafana
| Author | Product Version | Last Updated | Reference | Download |
|---|---|---|---|---|
| Ester Atzmon | 14.0 | January 2019 | InsightEdge-Grafana Connector |
Overview
Data visualization helps people understand the significance of data by placing it in a visual context. Patterns, trends and correlations can be exposed and recognized using data visualization software.
Data visualization software is also important for big data and advanced analytics projects. Businesses need a fast, easy way to get an overview of their data. Visualization is also key for advanced analytics; when implementing advanced predictive analytics or machine learning algorithms, the output needs to be visualized to monitor results and make sure that the data models are performing correctly.
The InsightEdge Platform can be easily integrated with Grafana , a graph and dashboard builder for visualizing time-series metrics so users can create, explore, and share their dashboards no matter where the data is stored.
To use Grafana for data visualization with InsightEdge, you will have to do the following:
- Download and configure the InsightEdge-Grafana connector.
- Download and install the Grafana client.
- Download and install the Grafana SimpleJson data source plugin (available from the Grafana website).
- Change the default port of the Grafana client (the default port is usually blocked).
- In the Grafana client, configure the data source and apply the URL for the InsightEdge-Grafana connector.
After making the above changes, you can visualize data from the Space using Grafana dashboards. The following sections provide detailed instructions on integrating InsightEdge and Grafana.
This sample integration was run in the following environment:
- InsightEdge Platform release 14.0.0
- Grafana version 5.2.4
- SimpleJson version 1.4.0
Downloading and Configuring the InsightEdge-Grafana Connector
The first step in integrating InsightEdge with Grafana is to download and configure the connector so that Grafana can access the data from the InsightEdge-based application.
The sample configuration files are located in the
grafana-insightedge.properties file and the path to the tableData.txt file (if you create different ones).To install the InsightEdge-Grafana connector:
- Clone the contents of the github repo.
Modify the grafana-insightedge.properties file to suit your local evironment (host, port, space name, lookup group, and lookup locator (optional)) or create a new properties file.
Sample configuration:
CONNECTOR_HOST=HostName
CONNECTOR_PORT=8082
XAP_SPACE_NAME=demo
XAP_LOOKUP_GROUPS=xap-14.0.0
#XAP_LOOKUP_LOCATORS=
Note
The syntax of the URL that is used to configure the simple JSON data source to work with the Space ishttp://<yourhost>:<port>/insightedge/metrics. The variables are based on values you added to the properties file.Modify the tablesData.txt file or create a new tableData.txt file that the connector will use to categorize the data.
Sample data values:
TelemetryVolt,com.gigaspaces.Telemetry,longDate,volt,machineID
TelemetryRotate,com.gigaspaces.Telemetry,longDate,rotate,machineID
TelemetryPressure,com.gigaspaces.Telemetry,longDate,pressure,machineID
TelemetryVibration,com.gigaspaces.Telemetry,longDate,vibration,machineID
Each row represents the following fields in Grafana (the values from the first line of the above sample are provided for reference):
- <display name of table as it appears in the dashboard> -
TelemetryPressure - <class name in the Space> -
com.gigaspaces.Telemetry - <timestamp field in the class (of type long)> -
longDate - <field name that contains the requested value (of type double)> -
pressure - <name of data series> -
machineID
- <display name of table as it appears in the dashboard> -
Installing and Configuring Grafana Products
Installing the Grafana Client (Dashboard Application)
Grafana is not bundled with GigaSpaces products, but the product installation is easy and straightforward.
To install Grafana:
- Download the client from the Grafanalabs download page .
- Follow the installation instructions .
Installing the SimpleJson Data Source Plugin
After you download and install the dashboard application, download and install the SimpleJson data source plugin.
To install the plugin:
- Download the plugin package from the Grafana plugin page .
- Open a command window from the
\binfolder of the Grafana client software. - Type
grafana-cli plugins install grafana-simple-json-datasource. The plugin is installed into your Grafana plugins directory; the default is /var/lib/grafana/plugins.
Configuring the Grafana Client
After installing the Grafana client and the SimpleJson data source plugin, you must configure the following so that Grafana will work with the InsightEdge connector and visualize the data in the Space:
- Change the default port of the Grafana client to an open port (the default port is usually blocked).
- Configure the data source.
To configure the data source:
- Run the Grafana server as described in the Grafana installation instructions.
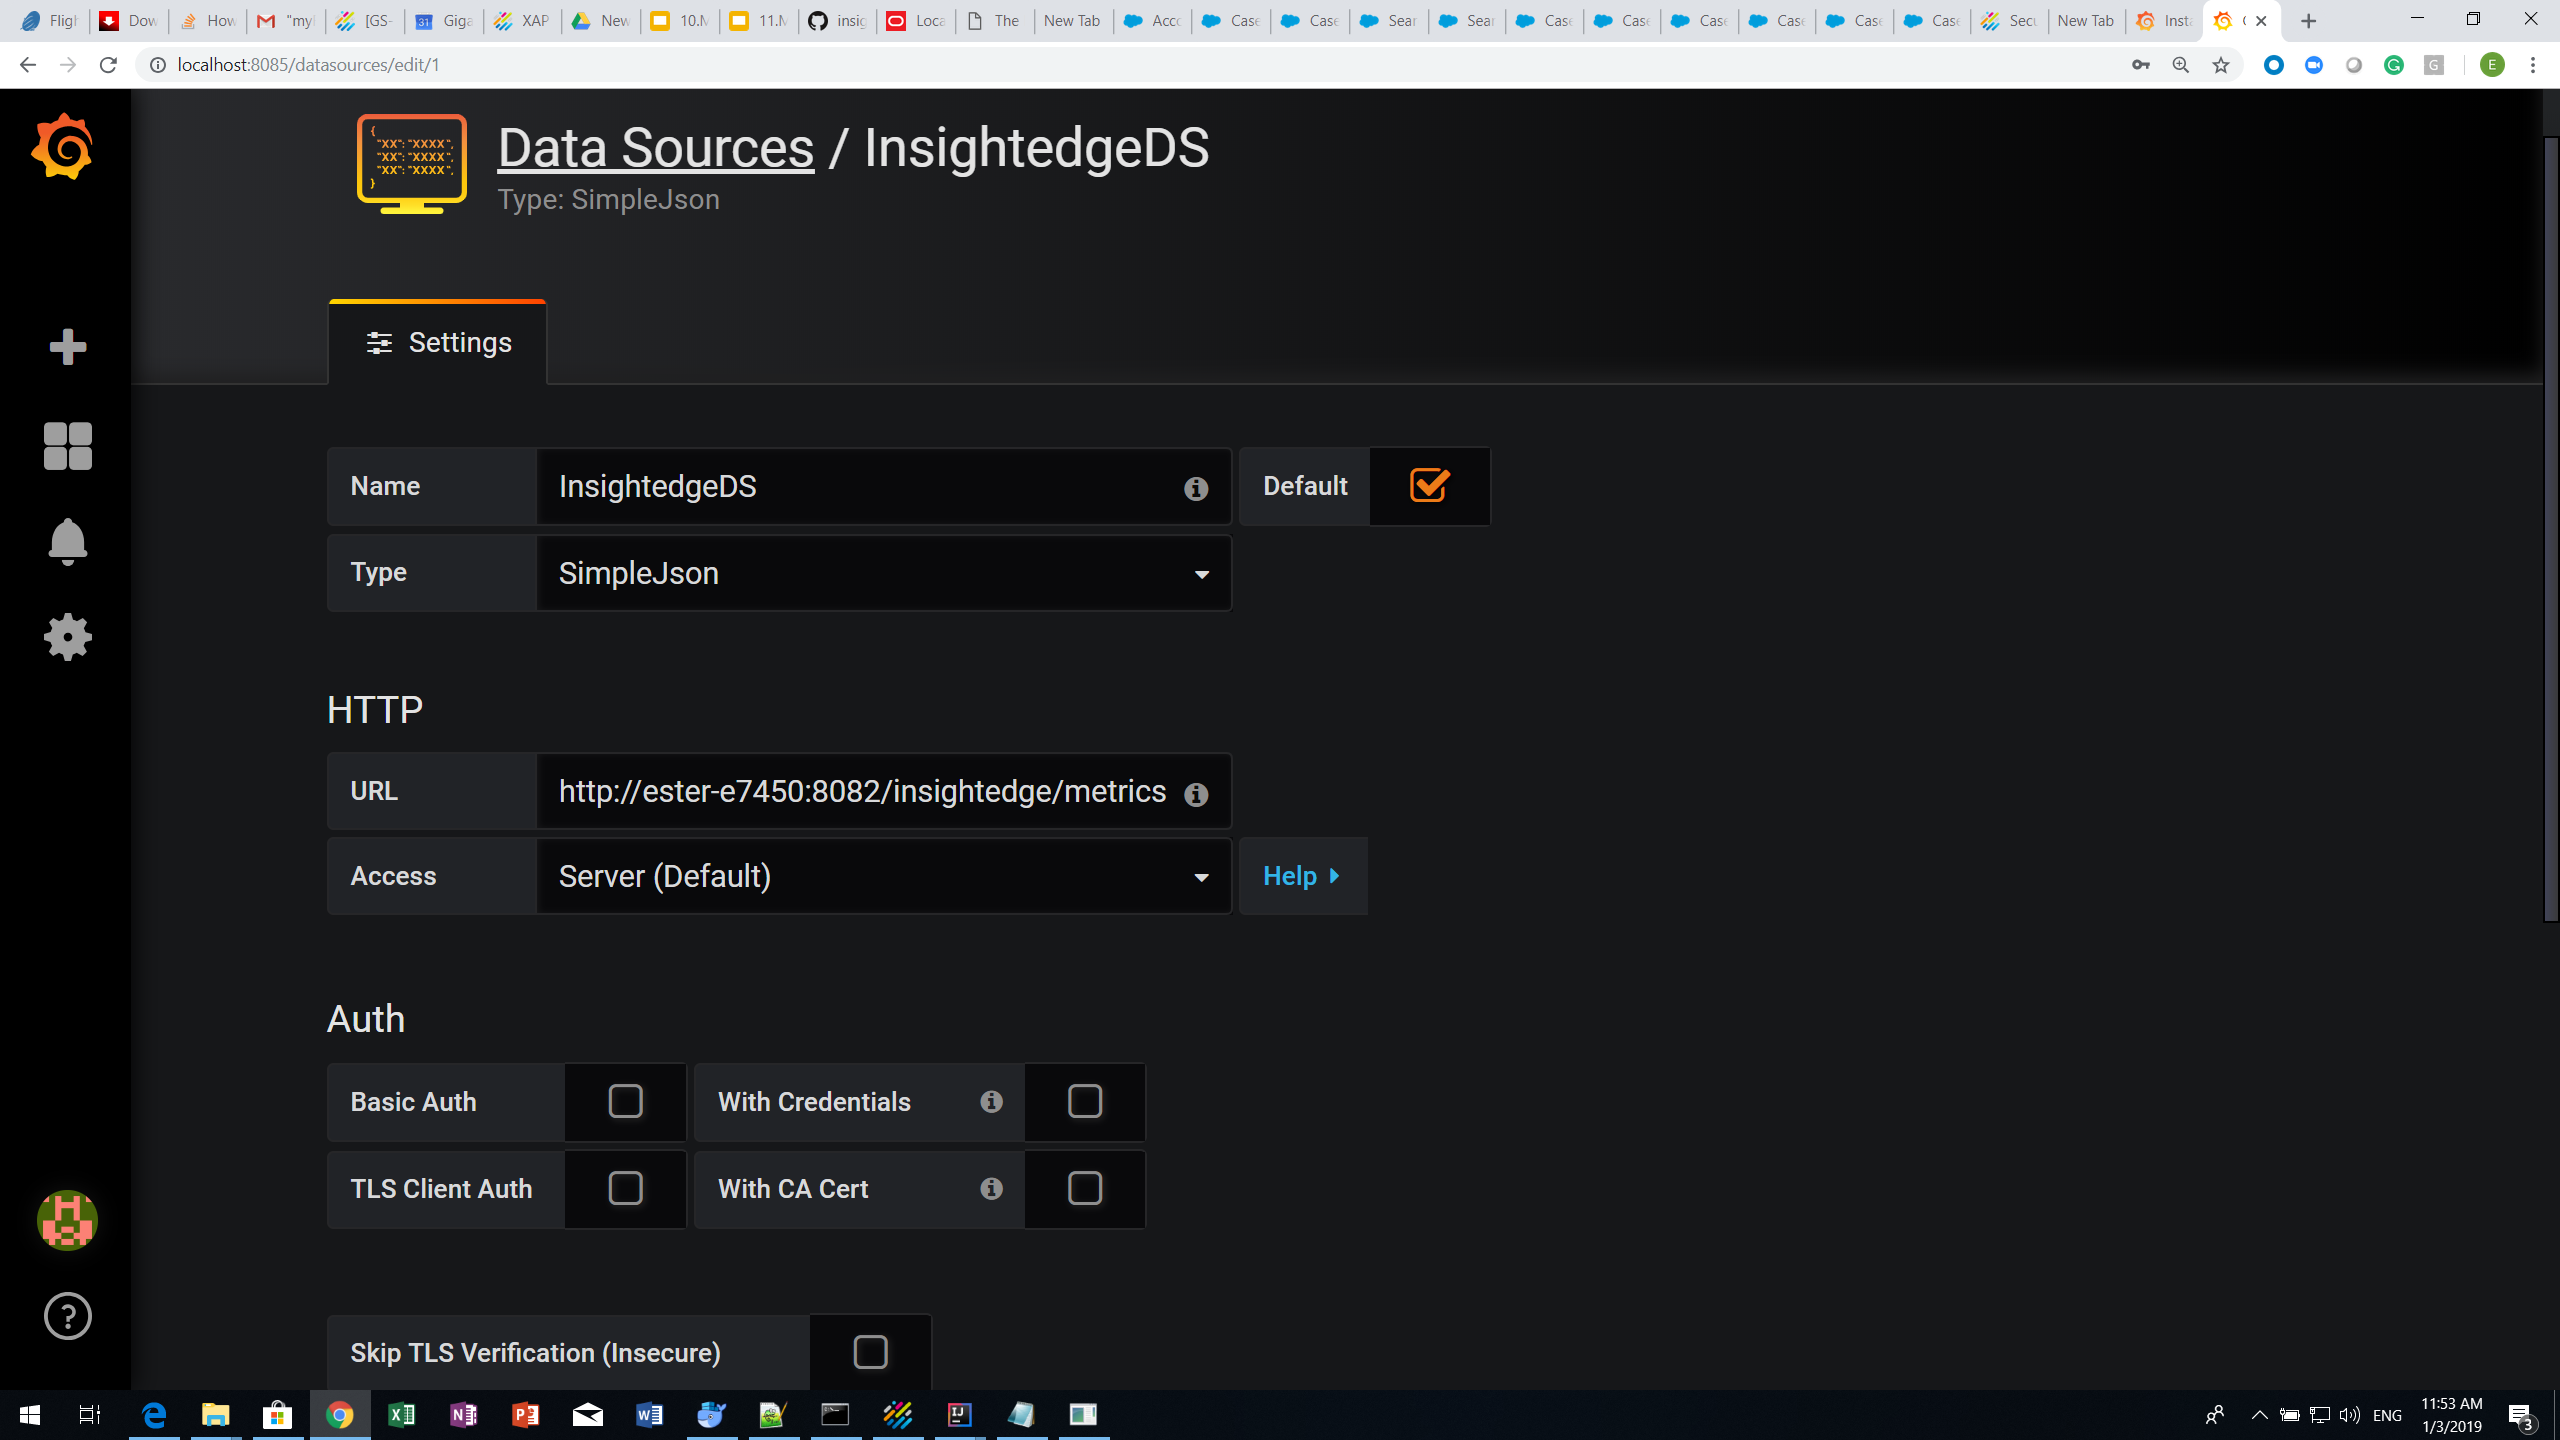
In the Settings tab of the Data Sources screen, configure the following:
- Assign a Name for the data source. For example, InsightedgeDS.
- Verify that the data source Type is SimpleJson.
- In the HTTP area, type the URL of the connector in the URL field using the syntax described in the section above.
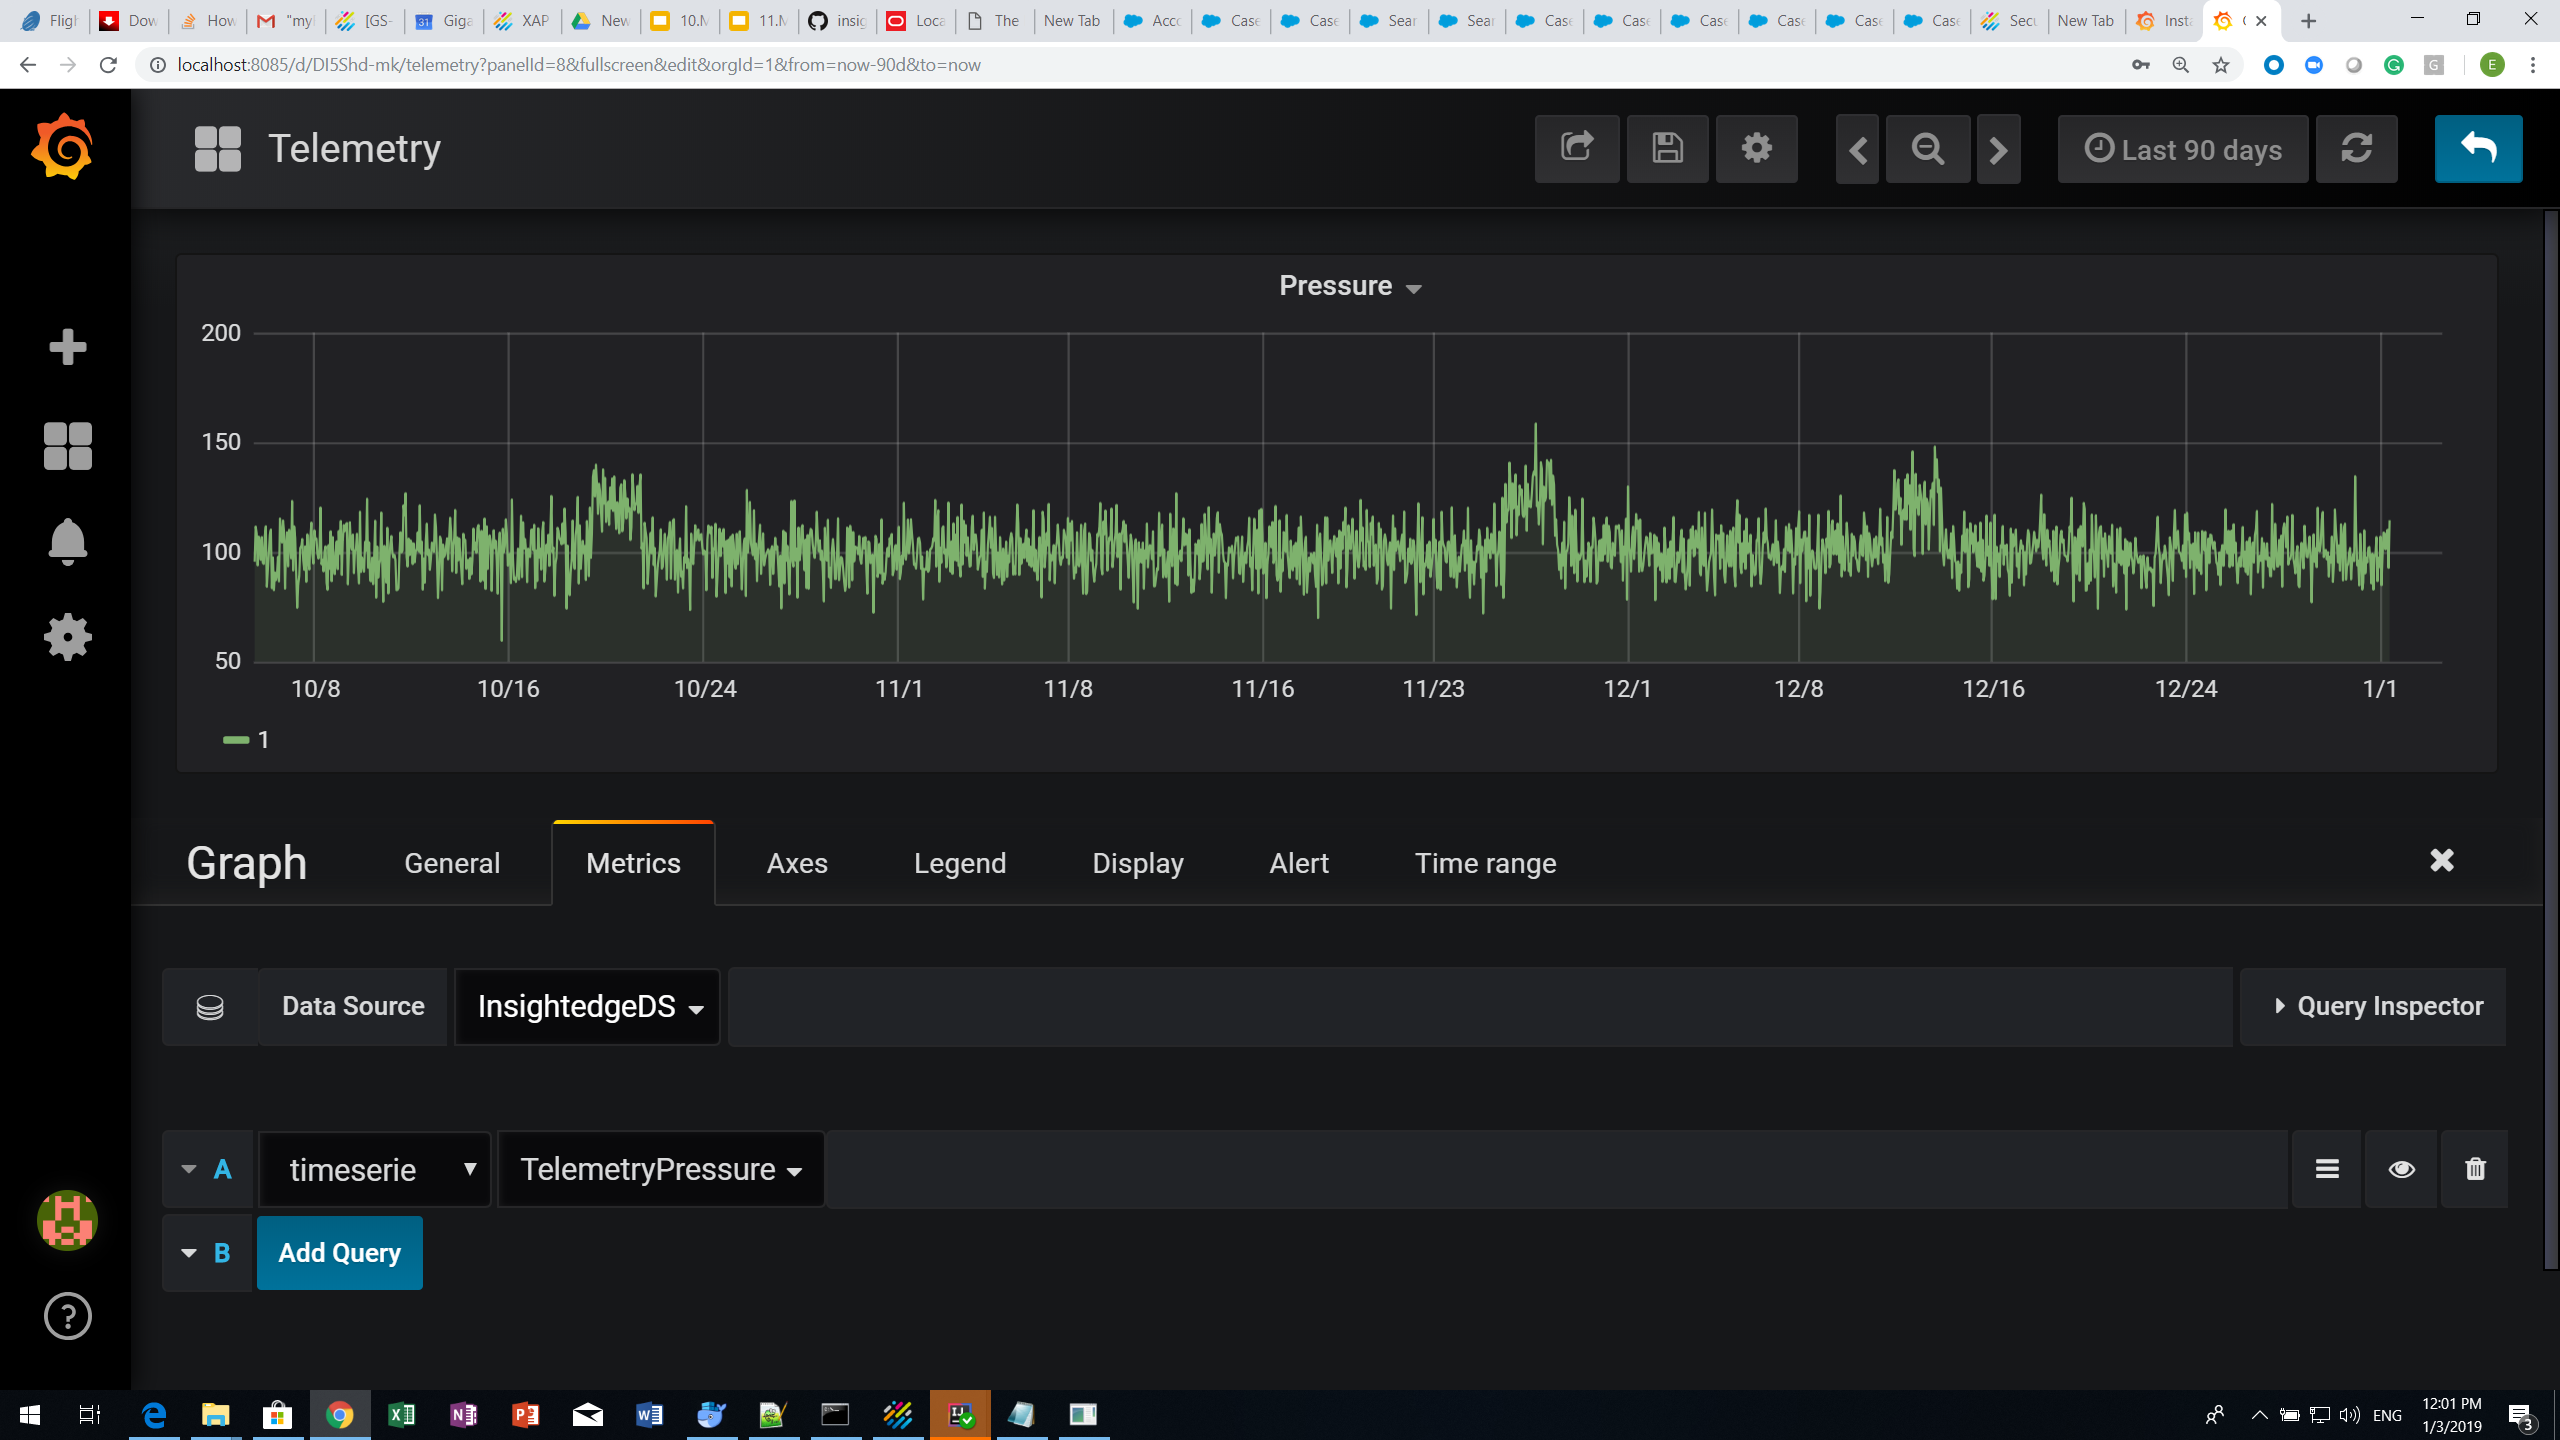
Visualizing the Data
After you finish configuring the Grafana client, you can create new dashboards to view the data from the Space. For example, using the sample data in the connector package, you can create a Telemetry dashboard, as shown below.
To view the Space data in the dashboard:
- In the upper-right area of the dashboard, define the time period for which you want to see data.
- In the Metrics tab below the graph, select the InsightedgeDS data source.
- Select TelemetryPressure from the dropdown list.