Cluster Overview
Services
A service in the Ops Manager may represent a GigaSpaces Processing Unit, or external services and applications such as Spark or remote/web applications. The following services are supported.
| Icon | Name | Description |
|---|---|---|
|
|
Stateless | Contains one or more microservices. This kind of service may act like a client that interacts with other services. |
|
|
Stateful | Contains data in a Space instance. A set of stateful services comprise a GigaSpaces data grid. |
|
|
Mirror | A mirror service is stateless and provides asynchronous persistence to ensure that data isn't lost. The mirror acts as a dispatcher, pushing all primary Space partition changes to the database (or any other data storage solution). |
|
|
Web | Allows deploying web applications using packaged or exploded WAR files. |
|
|
WAN gateway | Replicates services between different clusters for disaster recovery planning and data locality. |
In addition to the main services, you can also deploy the following service sub-type.
| Name | Description |
|---|---|
| MemoryXtend | Service that has been configured for MemoryXtend, and can separate the data in the Space between hot storage (RAM) and warm/cold storage (off-heap RAM or SSD). |
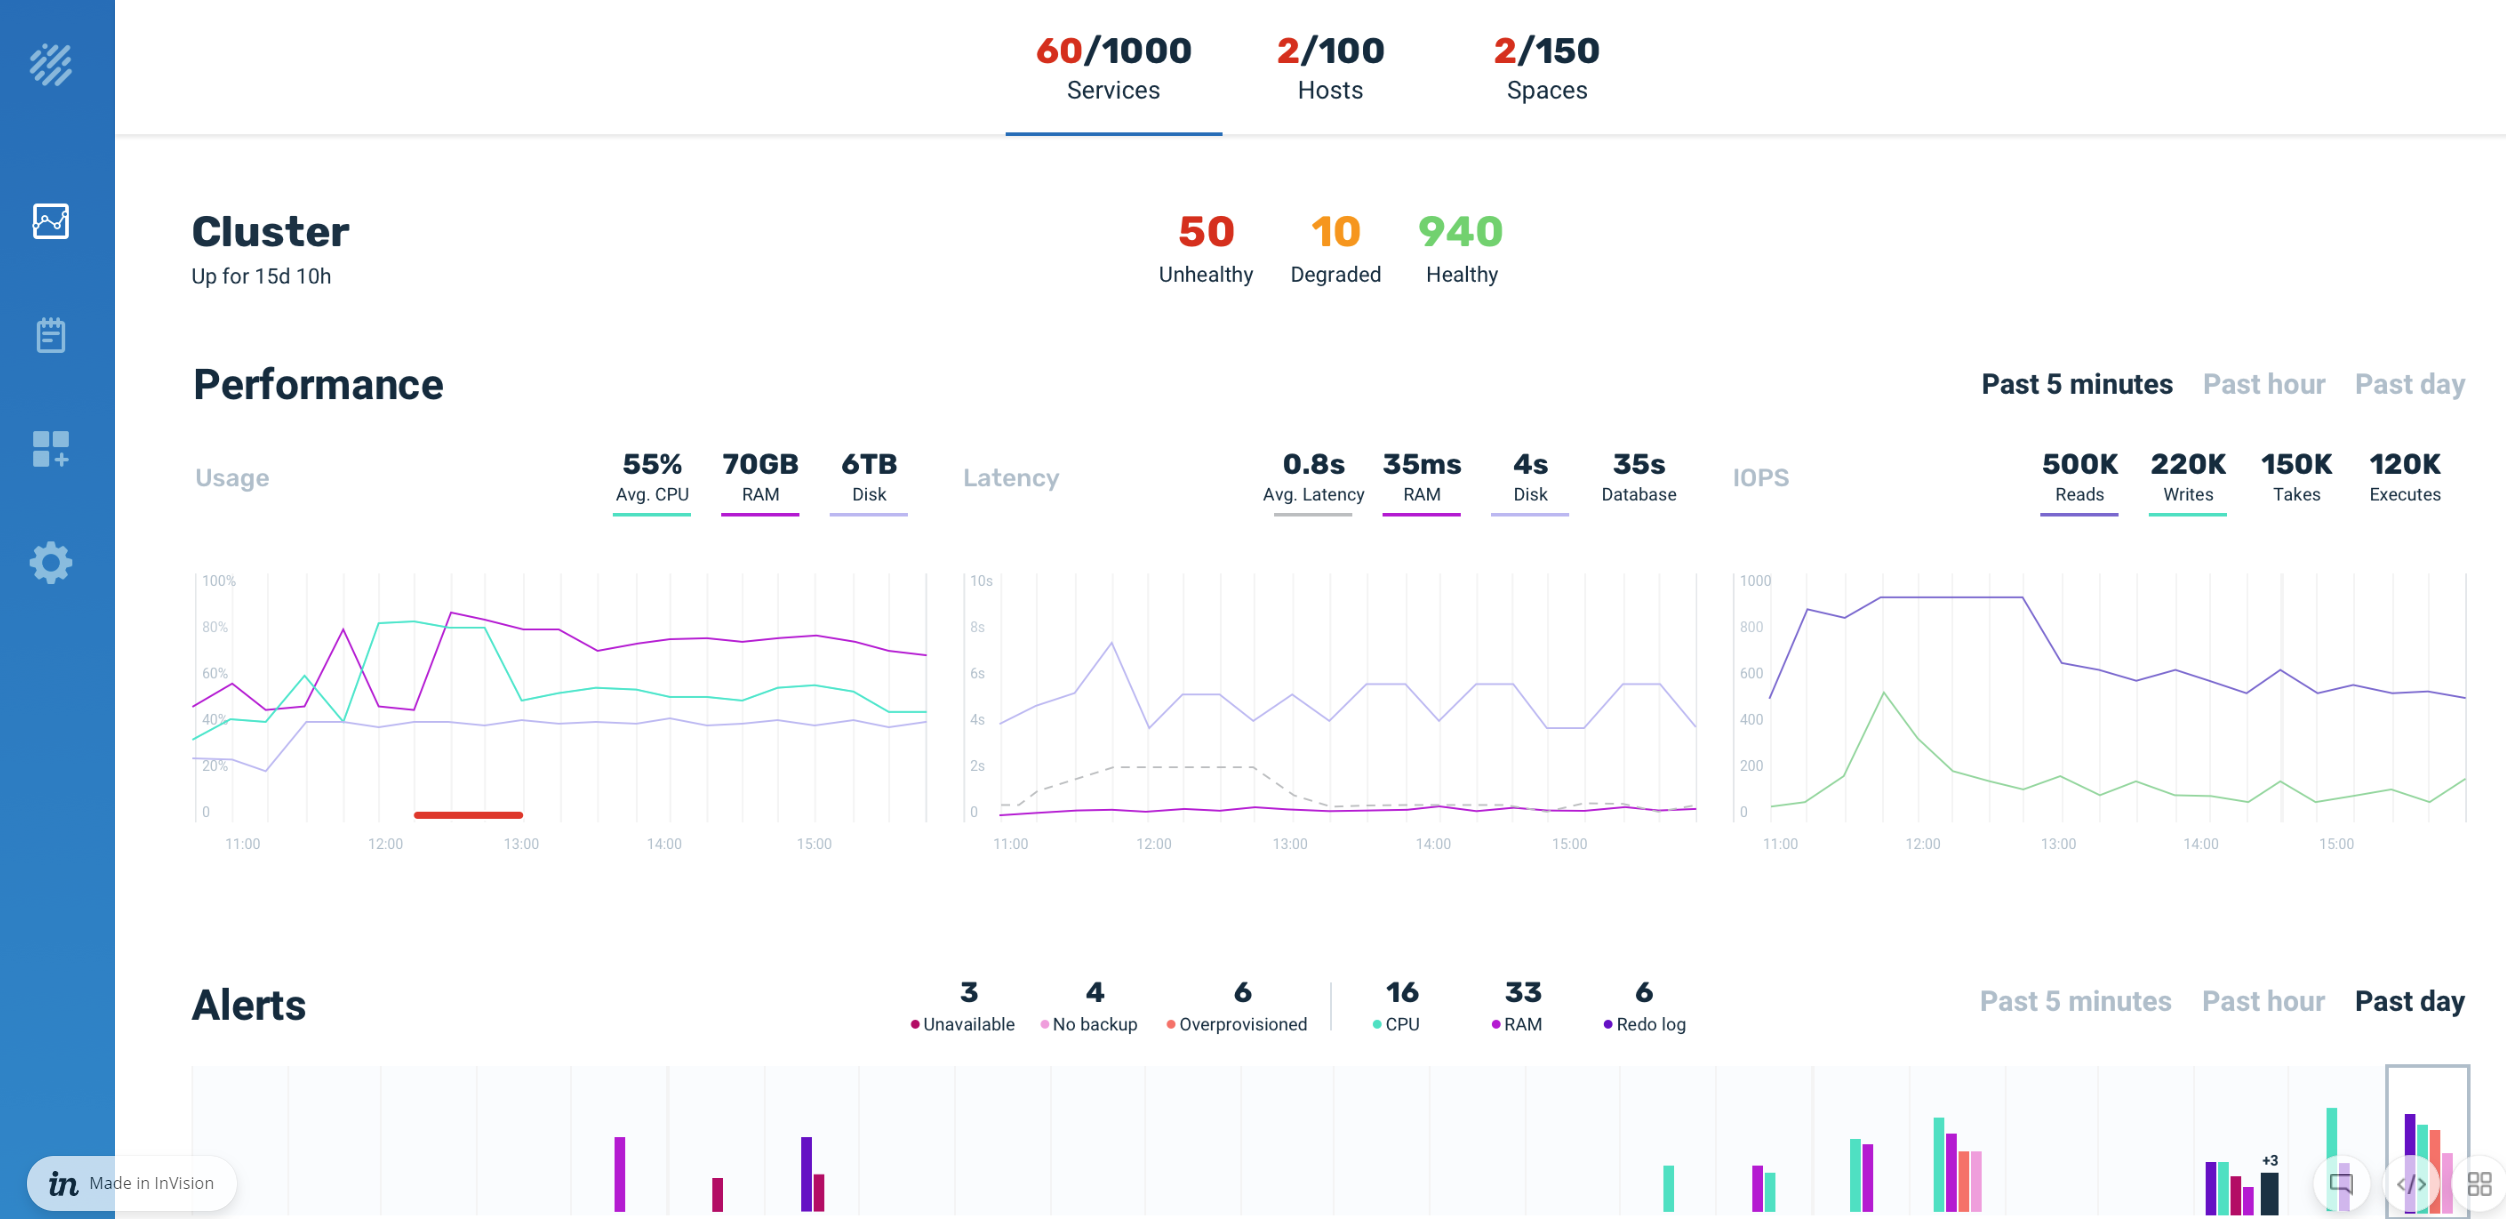
Cluster Metrics
Ops Manager includes graphs that display the following information:
- CPU usage - view the average CPU utilization as a percentage. This metric is available at the cluster level, and at the service level.
- IOPS - View the implemented IOPS types (such as reads, writes, takes, executes, etc. per second at the cluster level, and at the service level.
Ops Manager metrics can be ported to InfluxDB or other time series databases, so that you can use external monitoring and visualization tools (such as Grafana) to perform additional analysis.
Service Overview
The service overview shows a summary of all services vs. unhealthy services. You can also view the services sorted by health and severity. Additionally, you can apply filters by service type and RAM utilization, or search for specific services by name. Click a service to drill through to see the individual performance metrics and alerts for that service. For deeper analysis, you can create a dump file of the service logs via the download button in the upper right-hand corner.
In addition to reviewing the performance of individual services, you can drill down to the partition and instance level to review metrics such as CPU usage and memory consumption per specific instance.
Alerts
There are two types of alerts in Ops Manager, availability and resource. Alert summaries can be viewed at the service level, and you can drill through to specific service instances to view and analyze alerts by group and individually, to assess system and cluster performance and identify problem areas.
Availability
Availability alerts describe issues with service availability. The following alerts are used:
- Unavailable - the partition isn't responding (neither backup nor primary).
- No backup- there is no backup service for this primary service.
- Overprovisioned - the number of primary and backup services don't match.
Resource
Resource alerts have to do with system resources. The following resource alerts are available:
- CPU usage
- RAM
- Redo log
By default, the resource alerts are configured with a threshold of 80%. You can customize the resource thresholds for service types or individual services, as well as configure custom resource alerts, using the Ops Manager configuration file, which is located at <<GS_HOME>config/ui.

